Introduction TOGAF 10, the latest rendition of The Open Group Architecture Framework, known as TOGAF Standard, 10th Edition, introduces several
Continue reading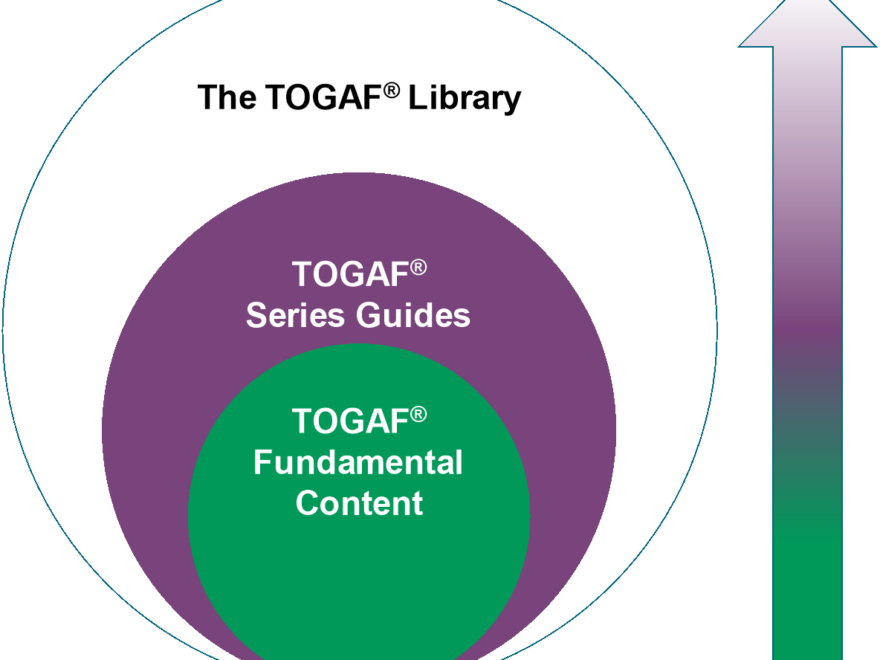
Learning one new thing everyday


Introduction TOGAF 10, the latest rendition of The Open Group Architecture Framework, known as TOGAF Standard, 10th Edition, introduces several
Continue reading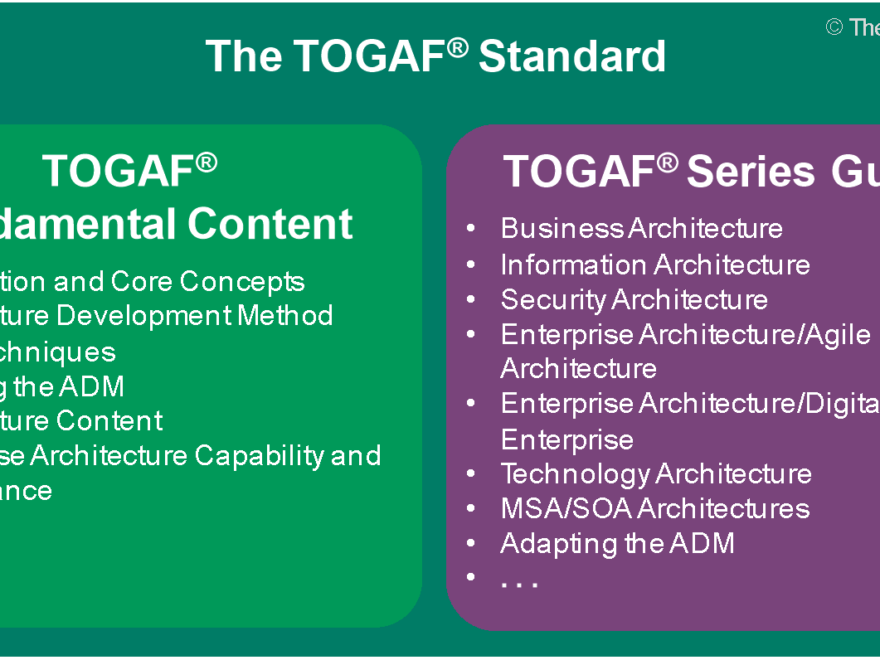
Introduction The unveiling of the TOGAF® Standard, 10th Edition marks a significant leap forward in the realm of Enterprise Architecture
Continue reading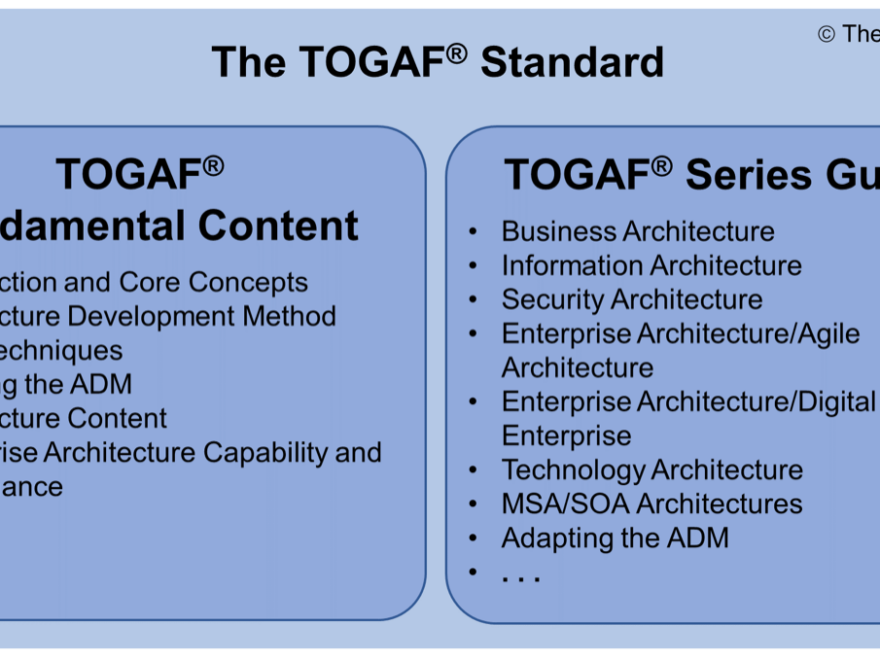
The eagerly awaited TOGAF Standard, 10th Edition has finally arrived, promising a plethora of enhancements and features to streamline the
Continue reading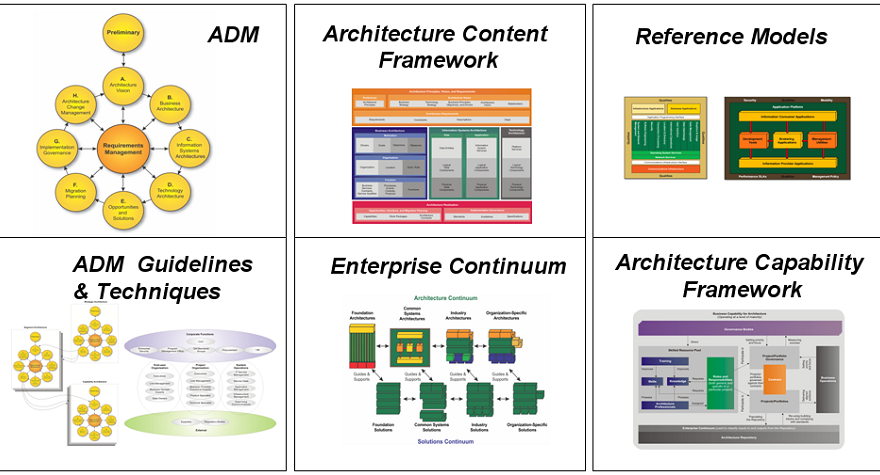
The Open Group Architecture Framework, or TOGAF®, isn’t just a catchy acronym; it’s a dynamic tool that has been guiding
Continue reading
Introduction Embark on a journey through the intricate world of TOGAF’s Architecture Development Method (ADM) with our comprehensive guide. As
Continue reading
Video marketing is effective for several reasons. Firstly, videos have a higher engagement rate compared to other forms of content,
Continue reading
In a world flooded with information and content, the ability to capture and retain an audience’s attention has become a
Continue reading
E-commerce businesses are constantly seeking innovative ways to stand out and engage their customers. One of the most powerful tools
Continue reading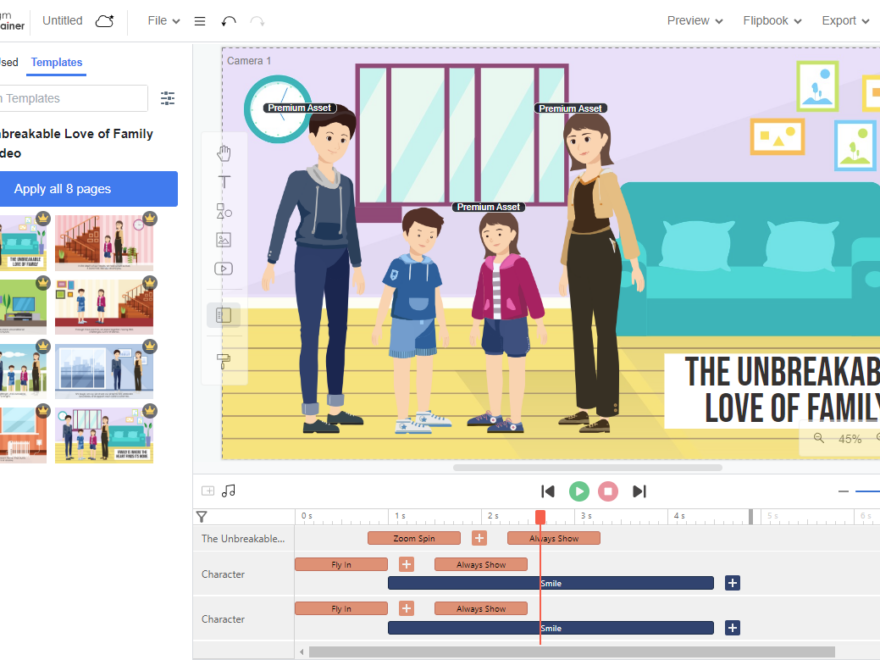
In the fast-paced digital landscape of 2021, where attention spans are shrinking, engaging and informative content is essential. Explainer videos
Continue readingIn today’s fast-paced digital world, effective communication is not just a valuable skill; it’s a necessity. Whether you’re a business
Continue reading