
Introduction
As a software architect with over 15 years of experience leading teams through complex system design, I’ve witnessed firsthand how state machine diagrams transform ambiguous requirements into precise, testable behavioral specifications. In today’s event-driven architectures—where microservices, IoT devices, and reactive user interfaces dominate—understanding how objects transition between states is no longer optional; it’s foundational.

This guide synthesizes core UML state diagram concepts with practical implementation patterns and modern AI-assisted tooling. Whether you’re modeling a simple toaster or a distributed order-processing system, state diagrams provide the clarity needed to prevent costly logic errors before code is written. I’ll share field-tested insights on when to use state machines, how to avoid common modeling pitfalls, and how AI tools like Visual Paradigm can accelerate your design workflow without sacrificing rigor.
Let’s dive into the mechanics, semantics, and strategic value of state machine diagrams.
What Are State Diagrams?
A state diagram (also called a state machine diagram or state chart) is a UML behavioral diagram that illustrates the dynamic view of a system by modeling the sequences of states an object traverses during its lifetime in response to events. State diagrams emphasize event-ordered behavior, making them especially powerful for modeling reactive systems—interfaces, controllers, protocol handlers, and any component whose behavior depends on both current input and historical context.
“The behavior of an entity is not only a direct consequence of its inputs, but it also depends on its preceding state.”
State machines can model any behavioral element—classes, use cases, subsystems, or entire systems—but are most commonly applied to classes in object-oriented design.
Key Elements of a State Machine
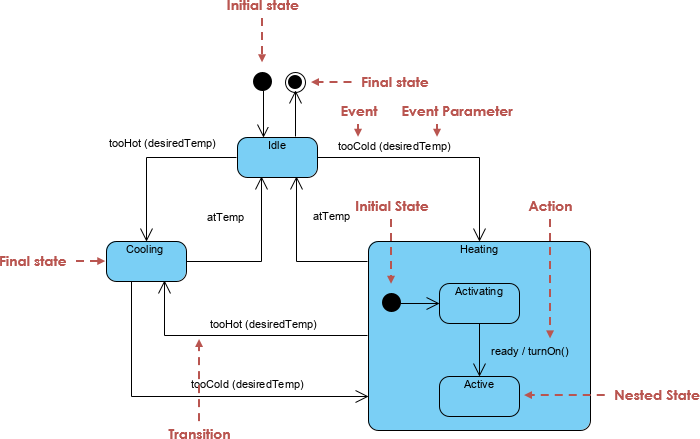
The figure below shows the key elements of a state diagram in UML. This notation permits you to visualize the behavior of an object in a way that lets you emphasize the important elements in the life of that object.
Core Definitions
| Element | Definition |
|---|---|
| State Machine | A behavior specifying sequences of states an object goes through during its lifetime in response to events, together with responses to those events. |
| State | A condition during an object’s life where it satisfies a condition, performs an activity, or waits for an event. Graphically rendered as a rectangle with rounded corners. |
| Event | A significant occurrence with location in time/space that can trigger a state transition. Types: Signal, Call, Time, Change. |
| Guard Condition | A boolean expression evaluated after a trigger event. Multiple transitions from the same state/event are allowed if guards don’t overlap. |
| Transition | A relationship between two states indicating that an object in the first state will perform actions and enter the second state when an event occurs and conditions are satisfied. Rendered as a solid directed line. |
| Action | An executable atomic computation resulting in a model state change or value return. |
| Activity | An ongoing, non-atomic execution within a state machine. |
Activity Diagrams vs. State Machine Diagrams
Understanding when to use each diagram type is critical for effective modeling.
Activity Diagrams
-
Capture high-level workflow and data flow
-
Emphasize concurrency and coordination of activities
-
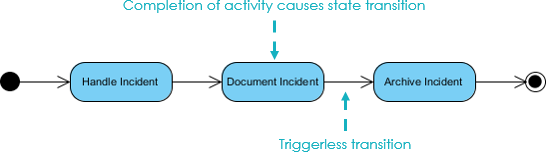
Vertices represent activities; edges represent completion transitions
-
Best for modeling business processes or algorithmic flows
State Machine Diagrams
-
Focus on object state evolution in response to events
-
Vertices represent object states; edges represent event-triggered transitions
-
Emphasize lifecycle management and reactive behavior
-
Best for modeling UI components, protocol handlers, or device controllers
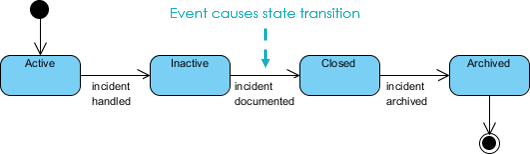
Rule of Thumb: Use Activity Diagrams for process flow; use State Machine Diagrams for object lifecycle.
Practical Example: Modeling a Toaster
Let’s apply these concepts to a tangible example: modeling the behavior of a toaster.
Basic State Machine
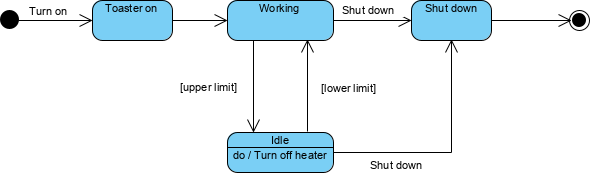
The initial state diagram models the core workflow: turn on → insert bread → heat → eject toast.
Refinement: Preventing Burnt Toast
To prevent burning, we introduce temperature monitoring with guard conditions:
-
When temperature reaches upper limit → transition to Idle state
-
When temperature drops below lower limit → transition back to Working state
This demonstrates how guard conditions enable precise control logic without cluttering the diagram.
Using Super-States and Sub-States
We can encapsulate temperature-monitoring logic within composite states:
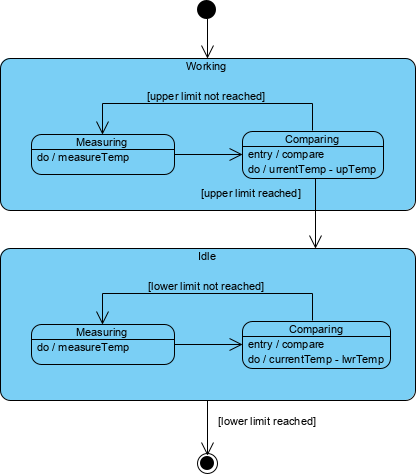
Benefits of Sub-States:
-
Reduce visual complexity through hierarchical abstraction
-
Reuse common behavior (e.g., temperature measurement) across states
-
Enable focused testing of nested logic
Concurrent Sub-States and Regions
For systems with parallel behaviors (e.g., heating element + timer), concurrent regions model independence:
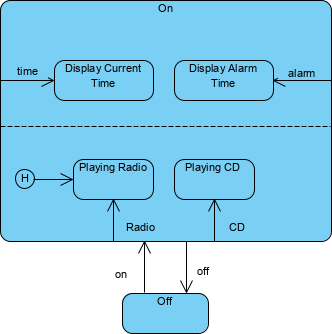
Each region operates independently, separated by dashed lines, and synchronizes only at defined join points.
History States: Remembering Where You Left Off
When re-entering a composite state, history states allow resumption from the last active sub-state:
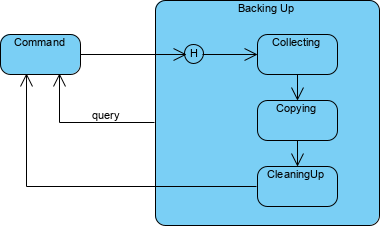
This is invaluable for modeling interruptible processes (e.g., pausing/resuming a download).
Associating State Diagrams with Classes
State machines gain practical power when bound to class implementations:

In this example, an instance c of class Phone is shown in state WaitingForAnswer. This linkage enables:
-
Direct traceability from design to code
-
Automated test case generation from state transitions
-
Runtime state introspection for debugging
Why State Machine Diagrams Matter: Real-World Impact
The Bank Account Example
Consider a withdrawal operation:
// Simple case: balance remains positive
balance = balance - amount; // Behavior unchanged

// Complex case: balance becomes negative
// → State transition fires → Different business rules apply
Key Insight: An object responds differently to the same event depending on what state it is in.
Testing Benefits
State diagrams naturally generate test cases:
-
Idle state receives “Too Hot” event
-
Heating state receives “Failure” event
-
History state re-entry validation
This systematic coverage reduces regression risks in reactive systems.
AI-Powered State Diagram Generation: Accelerating Design
After years of manually crafting state diagrams, I’ve embraced AI-assisted modeling to handle complexity while maintaining precision. Visual Paradigm’s AI tools transform natural language requirements into UML-compliant state machines.
Two Integration Paths
Option 1: Visual Paradigm Desktop
-
Navigate to Tools → AI Diagram Generation
-
Select State Machine Diagram
-
Enter prompt: “Generate state diagram for order lifecycle: Pending → Processing → Shipped → Delivered, with cancellation guard”
-
Review, refine guard conditions, and export to code
Option 2: AI Chatbot (Quick Prototyping)
-
Visit Visual Paradigm AI Chat
-
Describe behavior: “Model a support ticket: Open → Under Review → Closed, with escalation on timeout”
-
Refine via conversation: “Add ‘On Hold’ state with reactivation event”
-
Import final diagram into desktop project
AI Capabilities That Matter
-
🔄 Transition Discovery: Identifies missing transitions from requirements
-
🛡️ Guard Condition Suggestions: Proposes boolean expressions for edge cases
-
🎯 Dead-End Detection: Flags unreachable states before implementation
-
📐 Automatic Layout: Ensures UML compliance and readability
Pro Tip: Include specific states, events, and guard conditions in prompts for highest-quality output.
Field-Tested Best Practices
From leading teams across fintech, IoT, and SaaS domains, here are my non-negotiable guidelines:
-
Start Simple: Model core states first; refine with sub-states only when complexity demands it.
-
Name States Verbally: Use “WaitingForPayment” not “State3″—clarity aids collaboration.
-
Document Guard Conditions: Explicitly state boolean expressions; avoid implicit logic.
-
Validate with Scenarios: Walk through user stories to ensure all event/state combinations are covered.
-
Sync with Code: Use tooling that generates skeleton code from diagrams to prevent drift.
-
Leverage AI for Iteration: Use AI to brainstorm edge cases, then manually validate business logic.
Conclusion
State machine diagrams remain one of UML’s most underutilized yet powerful tools. In an era of increasingly reactive and distributed systems, the ability to precisely model how objects evolve over time is not just academically interesting—it’s a competitive advantage. By combining foundational UML semantics with modern AI-assisted tooling, teams can achieve both rigor and velocity: catching logical errors in design rather than production, generating test cases automatically, and maintaining living documentation that evolves with the codebase.
My recommendation? Start small. Model one critical component’s lifecycle this sprint. Use AI to accelerate the draft, then apply architectural judgment to refine the logic. Over time, you’ll build a library of reusable state patterns and a team fluent in event-driven thinking. The result: systems that are not just functional, but resilient, maintainable, and elegantly aligned with business requirements.
As the toaster example reminds us: even simple devices benefit from thoughtful state modeling. Imagine the impact when applied to your most complex domain.
- References
- Visual Paradigm AI Diagram Generation Features: Overview of AI-powered diagram creation capabilities including state machine support.
- Visual Paradigm AI Composite Structure Guide: Detailed guide on using AI for complex diagram generation with professional-grade output.
- YouTube: Create State Machine Diagrams with AI: Video tutorial demonstrating end-to-end AI-assisted state diagram creation.
- Create UML State Diagrams in Seconds with AI: Article showcasing rapid state diagram generation using AI prompts and refinement workflows.
- Mastering State Diagrams with Visual Paradigm AI: Case study applying AI-generated state diagrams to automated toll system design.
- Visual Paradigm AI Chatbot Features: Documentation on conversational AI interface for diagram generation and refinement.
- AI Diagram Generator Supports 13 Diagram Types: Release notes detailing expanded AI diagram generation capabilities.
- AI Diagram Generator Release Announcement: Official announcement of Visual Paradigm’s AI diagram generation feature set.
- Mastering UML State Machine Diagrams with AI: Comprehensive guide to leveraging AI for state machine modeling best practices.
- Visual Paradigm AI Diagram Generation Review: Independent review of AI diagramming capabilities across multiple use cases.
- Visual Paradigm AI Chat for State Machine Diagrams: Direct access to AI chatbot interface specialized for UML state machine generation.
- Create UML Object Diagrams with AI: Related article on AI-assisted object modeling techniques.
- YouTube: State Machine Diagram Tutorial: Full video walkthrough of state diagram concepts and AI tool integration.
- Guide to Powered UML Diagram Generation: Chatbot-accessible guide for advanced AI diagramming techniques.
- YouTube: Advanced State Diagram Techniques: Video covering complex state machine patterns including history states and concurrency.
- AI Guide for Automated Toll Systems: Domain-specific application of AI-generated state diagrams to transportation systems.