


Data flow diagrams (DFDs) are visual representations that illustrate the flow of information within a system. They are used to describe the processes and data flows in a structured manner, and are useful in analyzing, designing, and documenting information systems.
What is a Data Flow Diagram (DFD)?
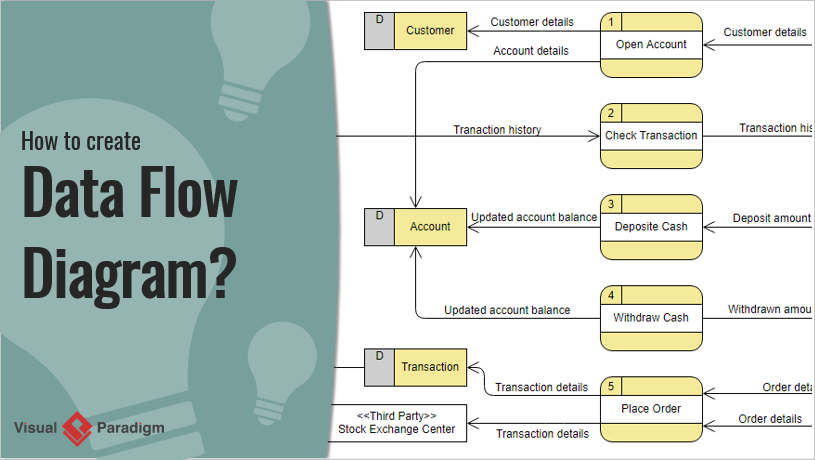
A Data Flow Diagram is a graphical representation of the flow of data through a system. It shows the inputs and outputs of each process, the data stored in data stores, and the flow of data between these components. The purpose of a DFD is to illustrate the flow of data within a system and to provide a clear and concise view of how the system functions.
Why are DFDs important?
DFDs are important because they provide a structured way to analyze and design information systems. They allow for a clear understanding of the system’s inputs, outputs, and processes, which can help to identify potential problems and inefficiencies. DFDs are also useful in documenting information systems, as they provide a visual representation of the system that can be easily understood by both technical and non-technical stakeholders.
Brief history of DFDs:
DFDs were first introduced by Larry Constantine and Ed Yourdon in their book “Structured Design” in 1979. The technique was initially used in the development of large, complex software systems. Over time, DFDs have been adapted for use in a wide range of industries and have become an important tool for systems analysis and design.
Basic Concepts of Data Flow Diagrams:
The basic concepts of DFDs include the components of the system, the processes that occur within the system, the data stores that hold data within the system, and the data flows that move data between these components. DFDs can be created at different levels of abstraction, from a high-level context diagram that shows the system in relation to its environment, to detailed diagrams that show the internal workings of the system. The different levels of abstraction allow for a detailed analysis of the system at different levels of detail.
Elements of a DFD
Data Flow Diagrams (DFDs) consist of several elements that work together to represent a system and its data flow. In this section, we will explore the types of DFDs, rules for constructing DFDs, benefits of using DFDs, and the steps involved in creating a DFD.
Symbols Used in Data Flow Diagrams
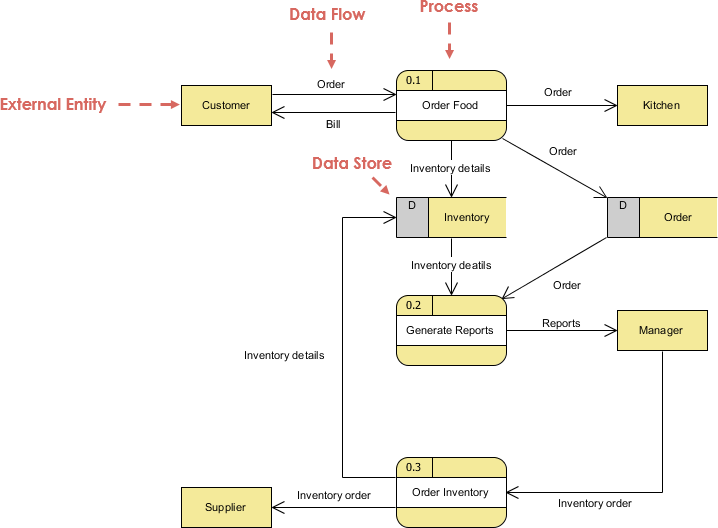
Data Flow Diagrams (DFDs) use symbols to represent different elements of a system and their relationships. In this section, we will explore the symbols used in DFDs, including external entities, processes, data stores, and data flow.
Different authors and methodologies have developed their own notation systems for DFDs, resulting in slight variations in the symbols used. However, the basic concepts and principles of DFDs remain the same across these notations, and the choice of notation usually depends on the specific project or organization’s preferences.
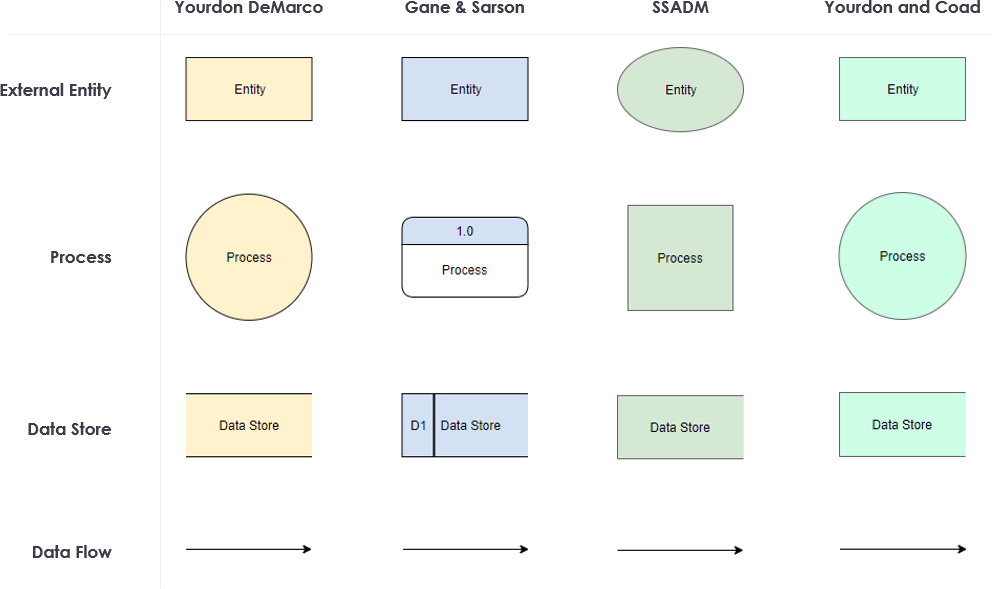
It’s important to note that regardless of the notation used, the purpose of a DFD remains to represent the flow of data through a system in a clear and concise manner.
External Entities:
External entities are entities outside of the system that interact with the system. They are represented by rectangles on the edges of the DFD. External entities are sources of input or destinations of output and are labeled to indicate their role in the system. Examples of external entities include customers, suppliers, and regulatory bodies.
Processes:
Processes represent the activities or tasks performed by the system. They are represented by circles or rounded rectangles in the DFD. Each process has a unique label that describes the function it performs. Processes can receive input, produce output, or perform both functions.
Data Stores:
Data stores represent the places where data is stored in the system. They are represented by rectangles with parallel lines on the sides in the DFD. Data stores can be physical, such as a filing cabinet, or electronic, such as a database. Each data store has a unique label that describes the type of data it contains.
Data Flows:
Data flows represent the movement of data between processes and data stores. They are represented by arrows in the DFD. Data flows are labeled to describe the data being transmitted. Each data flow has a direction, indicating whether it is input or output from a process or data store.
The symbols used in DFDs provide a graphical representation of a system and its components. Understanding the symbols used in DFDs is essential for creating and interpreting DFDs. By using these symbols, stakeholders can visualize the flow of data and processes in the system and identify potential areas for improvement.
Types of DFDs:
There are three types of DFDs:
- Context diagram: A context diagram shows the system as a single process and its interactions with external entities. It is the highest level of a DFD and provides an overview of the system.
- Level 0 diagram: A level 0 diagram shows the major processes of the system, including the inputs, outputs, and data stores. It provides a more detailed view of the system than the context diagram.
- Lower-level diagrams: Lower-level diagrams show the processes in more detail, with more processes and data stores included at each level. They provide a more detailed view of the system and can be used to identify areas for improvement.
Rules for constructing DFDs:
To create an effective DFD, there are several rules that should be followed:
- Start with a context diagram: A context diagram provides an overview of the system and its interactions with external entities. It is the foundation of a DFD and should be created first.
- Use clear and concise notation: To ensure that the DFD is easy to understand and communicate, clear and concise notation should be used. This includes using consistent symbols and conventions throughout the diagram.
- Ensure the diagram is balanced: The inputs to a process must equal its outputs, ensuring that the system is complete and that no data is lost or duplicated.
- Include all necessary processes and data stores: The DFD should include all processes and data stores necessary for the system to function properly. This ensures that the DFD is complete and that no critical information is left out.
Benefits of using DFDs:
There are several benefits to using DFDs:
- Improves system understanding: DFDs provide a clear and concise way to represent a system and its components, making it easier to understand and communicate.
- Identifies areas for improvement: DFDs can help identify areas of inefficiency or redundancy in a system, allowing for potential improvements to be made.
- Basis for other system documentation: DFDs can be used as a basis for creating other system documentation, such as functional requirements and test cases.
- Facilitates collaboration: DFDs can facilitate collaboration between stakeholders by providing a shared understanding of the system.
Creating a Data Flow Diagram:
The following are the steps involved in creating a DFD:
- Identify processes and data flows: The first step in creating a DFD is to identify the processes and data flows involved in the system. This can be done through interviews with stakeholders and analysis of system documentation.
- Create a context diagram: The context diagram shows the system as a single process and its interactions with external entities. It is the foundation of a DFD and should be created first.
- Create level 0 and subsequent levels of DFDs: After the context diagram is created, the next step is to create the level 0 diagram, which shows the major processes of the system. Subsequent levels show the processes in more detail, with more processes and data stores included at each level.
- Guidelines for creating a DFD: When creating a DFD, it is important to follow guidelines to ensure that the diagram is easy to understand and communicate. This includes using clear and concise notation, avoiding unnecessary complexity, and using consistent symbols and conventions throughout.
The elements of a DFD consist of types of DFDs, rules for constructing DFDs, benefits
Steps to create a DFD
Creating a DFD involves identifying the processes and data flows involved in the system, creating a context diagram, creating level 0 and subsequent levels of DFDs, and following guidelines for creating a DFD. This process can be time-consuming, but it is an important step in analyzing and designing a system. The following are the steps involved in creating a DFD:
- Identifying processes and data flows: The first step is to identify the processes and data flows involved in the system. This can be done through interviews with stakeholders and analysis of system documentation. The aim is to identify all the processes and data flows in the system.
- Creating a context diagram: The context diagram shows the system as a single process and its interactions with external entities. It is the foundation of a DFD and should be created first. The context diagram should show the inputs and outputs of the system and the external entities that interact with the system.
- Creating level 0 and subsequent levels of DFDs: After creating the context diagram, the next step is to create the level 0 diagram. The level 0 diagram shows the major processes of the system, including the inputs, outputs, and data stores. It provides a more detailed view of the system than the context diagram. Subsequent levels show the processes in more detail, with more processes and data stores included at each level. The aim is to create a series of diagrams that show the system at different levels of detail.
- Guidelines for creating a DFD: When creating a DFD, it is important to follow guidelines to ensure that the diagram is easy to understand and communicate. This includes using clear and concise notation, avoiding unnecessary complexity, and using consistent symbols and conventions throughout. The diagram should be easy to read, and it should clearly show the data flows and processes in the system.
Advanced Concepts of Data Flow Diagrams
Data Flow Diagrams (DFDs) are a powerful tool for visualizing system components and data flow. In addition to the basic concepts of DFDs, there are several advanced concepts that can help create more complex and comprehensive diagrams. These advanced concepts include Decomposition, Balancing, Partitioning, and Levels of Abstraction.
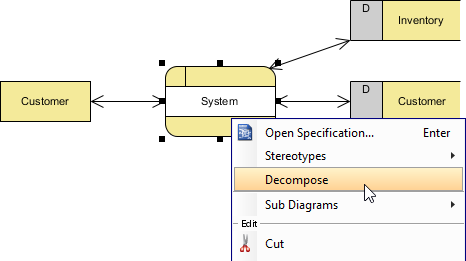
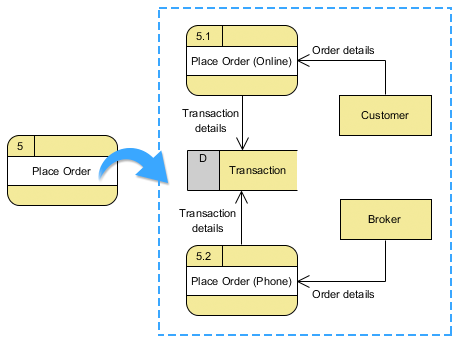
Decomposition:
Decomposition is the process of breaking down a complex system into smaller, more manageable components. In DFDs, decomposition is represented by creating more detailed diagrams that show the processes and data flows at lower levels. Each level of the diagram represents a more detailed view of the system, with more processes and data stores included at each level.
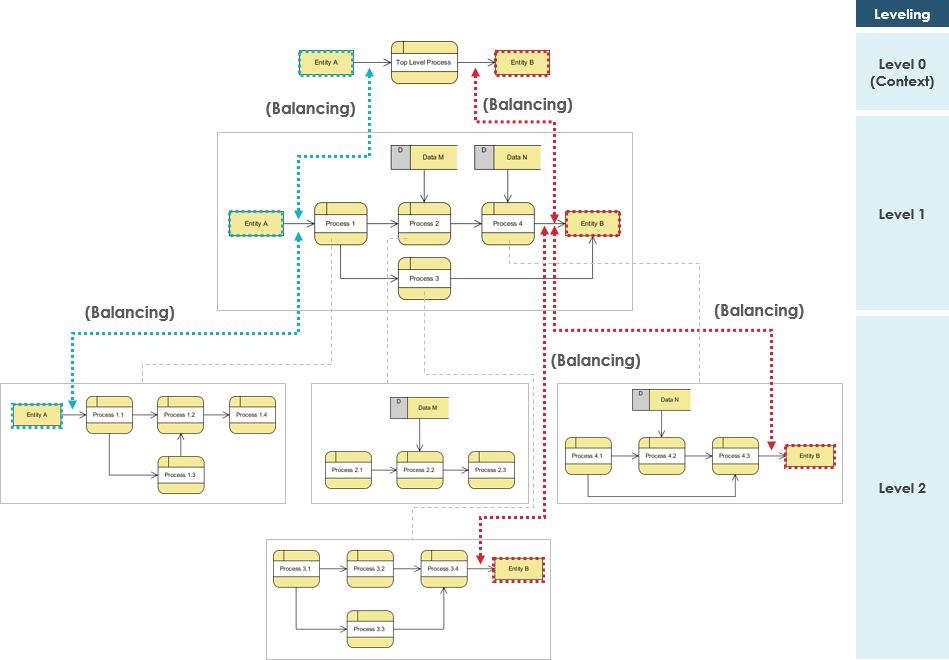
Balancing:
Balancing is the process of ensuring that the inputs to a process equal the outputs. This is important to ensure that the system is complete and that no data is lost or duplicated. In DFDs, balancing is represented by ensuring that the data flows into and out of a process are equal. If they are not, the diagram is not balanced, and the issue must be resolved.
Partitioning:
Partitioning is the process of separating a system into smaller subsystems that can be analyzed and managed separately. In DFDs, partitioning is represented by creating separate diagrams for each subsystem. This allows for a more detailed analysis of each subsystem and can help identify areas for improvement.
Levels of Abstraction:
Levels of Abstraction refer to the level of detail included in a DFD. A higher level of abstraction includes less detail and provides a more general overview of the system, while a lower level of abstraction includes more detail and provides a more specific view of the system. In DFDs, the context diagram is the highest level of abstraction, while subsequent diagrams provide a lower level of abstraction with more detail.
The advanced concepts of DFDs such as Decomposition, Balancing, Partitioning, and Levels of Abstraction can help create more complex and comprehensive diagrams that provide a detailed view of a system’s components and data flow. These advanced concepts can help identify areas for improvement and facilitate effective system analysis and management.
Tools for Creating Data Flow Diagrams
Tools for creating Data Flow Diagrams (DFDs) are important as they allow users to create accurate and effective diagrams efficiently. In this section, we will provide an overview of software tools for DFDs, compare different tools, and provide tips for choosing the right tool for your DFD needs.
Overview of software tools for DFDs:
There are several software tools available for creating DFDs. Some of the popular ones include:
- Microsoft Visio: Microsoft Visio is a powerful diagramming tool that is widely used for creating DFDs. It offers a range of features and templates that make it easy to create effective diagrams.
- Visual Paradigm Online: Visual Paradigm Online is a cloud-based diagramming tool that allows users to create DFDs and other types of diagrams. It offers a range of templates and features that make it easy to create high-quality diagrams.
- Visual Paradigm Desktop: Visual Paradigm is a powerful diagramming tool that allows users to create DFDs and other types of diagrams. It offers a range of templates and features that make it easy to create professional-looking diagrams.
Comparison of different tools:
When choosing a tool for creating DFDs, it is important to compare different tools to find the one that best meets your needs. Some factors to consider when comparing tools include:
- Ease of use: The tool should be easy to use, with an intuitive interface and clear instructions.
- Range of features: The tool should offer a range of features for creating DFDs, including the ability to add symbols, labels, and other elements to the diagram.
- Templates: The tool should offer a range of templates for creating DFDs, including templates for different types of DFDs.
- Cost: The cost of the tool should be considered, including any ongoing costs such as subscription fees.
- Integration: The tool should integrate with other software tools that are used in the organization, such as project management software or other diagramming tools.
Tips for choosing a tool for DFDs:
When choosing a tool for creating DFDs, consider the following tips:
- Determine your needs: Identify the specific needs of your organization, including the types of DFDs that need to be created, the number of users, and the level of expertise of the users.
- Consider the features: Look for a tool that offers the features that are needed for creating effective DFDs, including symbols, templates, and the ability to add labels and other elements.
- Try before you buy: Many tools offer a free trial or demo, allowing users to test the tool before making a purchase.
- Get user feedback: Ask users who will be using the tool for their input and feedback to ensure that the tool meets their needs.
- Consider support and training: Look for a tool that offers support and training to help users get up to speed quickly and resolve any issues that may arise.
Choosing the right tool for creating DFDs is an important decision that can have a significant impact on the effectiveness of the diagrams. By considering the features, ease of use, and cost of different tools, organizations can find the tool that best meets their needs and helps them create accurate and effective DFDs.
Conclusion
Data Flow Diagrams (DFDs) are a valuable tool for understanding and documenting complex systems. They provide a clear and concise way to represent a system and its components, making it easier to understand and communicate.
- By following the guidelines for constructing DFDs and using the appropriate symbols, you can create an effective diagram that accurately represents your system. Additionally, there are several software tools available to help create and manage DFDs.
- By considering the types of DFDs, rules for constructing them, and advanced concepts like decomposition and balancing, you can create a detailed and accurate representation of your system.
- By utilizing DFDs, you can identify areas for improvement, facilitate collaboration between stakeholders, and create a basis for other system documentation.
Resources on DFD
- Online Data Flow Diagram Maker
- What is Data Flow Diagram (DFD)? How to Draw DFD?
- What is Data Flow Diagram?
This post is also available in Deutsch, Español, فارسی, Français, English, Bahasa Indonesia, 日本語, Polski, Portuguese, Ру́сский, Việt Nam, 简体中文 and 繁體中文.