


What is UML?
UML stands for Unified Model Language, which is a standardized modeling language consisting of a set of 14 different types of UML diagrams.
Why use UML?
By using UML, the entire software design is easier to read and understand prior to software development, thus reducing development risks. Also, it facilitates communication between various developers.
UML provides a very expressive modeling language that allows different people in the software development process to get the information they are interested in.
The main purposes of UML can be summarized as follows:
- Provide users with a ready-made, expressive visual modeling language so they can develop and communicate meaningful models in a collaborative team effort.
- Provides extensibility and specialization mechanisms for core concepts.
- Independent of a specific programming language and development process.
- Provides a formal foundation for understanding modeling languages.
- Encourage the development of the market for object-oriented tools.
- Support for higher level development concepts such as collaboration, frameworks, patterns and components.
- Integrate Best Practices.
What are UML diagrams?
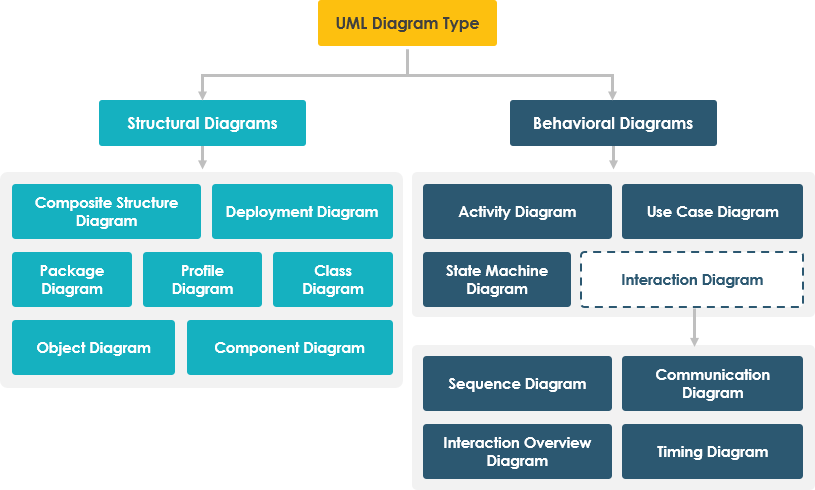
- UML diagrams are divided into structural diagrams and behavioral diagrams.
- Structure diagrams are divided into class diagrams, profile diagrams, component diagrams, composite structure diagrams, object diagrams, deployment diagrams, and package diagrams.
- Behavior diagrams are divided into activity diagrams, use case diagrams, state machine diagrams and interaction diagrams.
- Interaction diagrams are further divided into sequence diagrams, sequence diagrams, communication diagrams, and interaction overview diagrams.
14 Types of UML Diagrams
- Class diagram – A class diagram is a static diagram that describes the structure of a system by showing its classes and their properties and operations, as well as the relationships between objects.
- Use Case Diagram – A use case diagram consists of use cases, roles, and the relationships between them. It shows how users interact with the system and defines the specifications of the use cases.
- Sequence diagram – A sequence diagram is a model for communication between objects in a sequential manner. It shows the exact order of objects, classes and roles and information involved in a scenario. It consists of vertical lines belonging to lifelines and horizontal lines of messages.
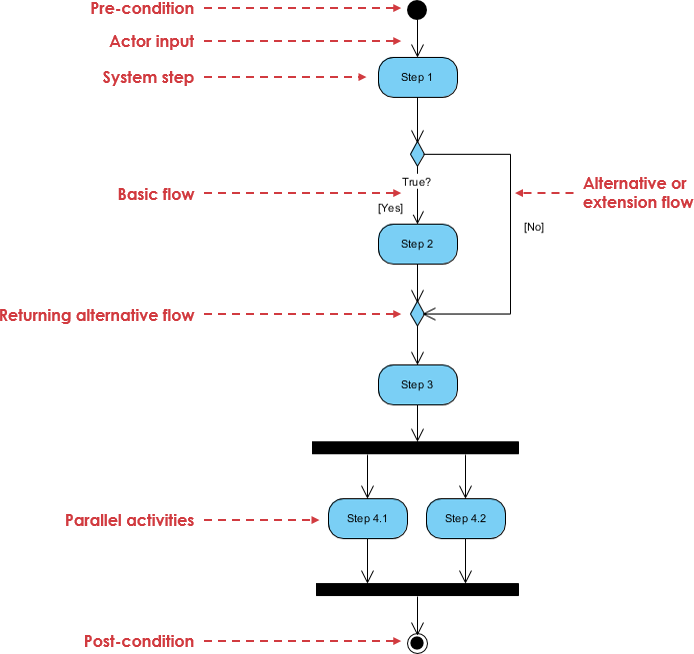
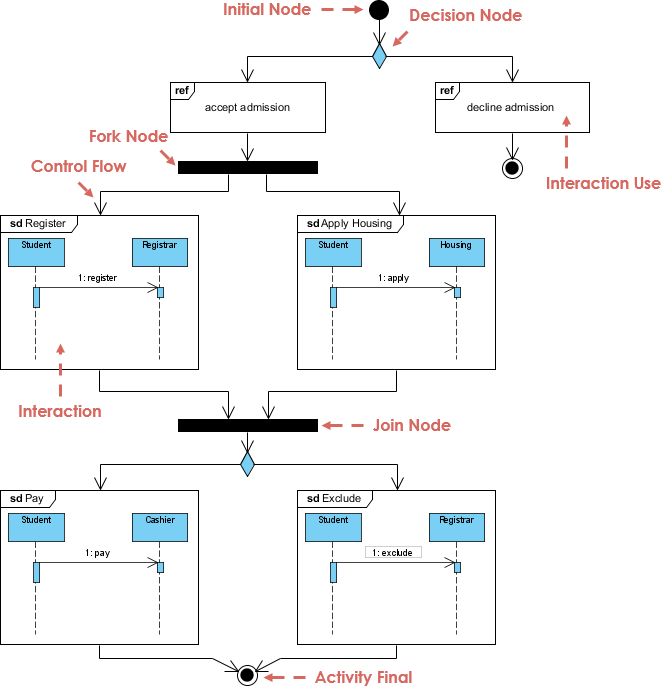
- Activity diagram – An activity diagram is a behavior diagram that shows a scenario in terms of the flow of actions. It models a sequence of actions, condition-based decisions, concurrent branches and various loops.
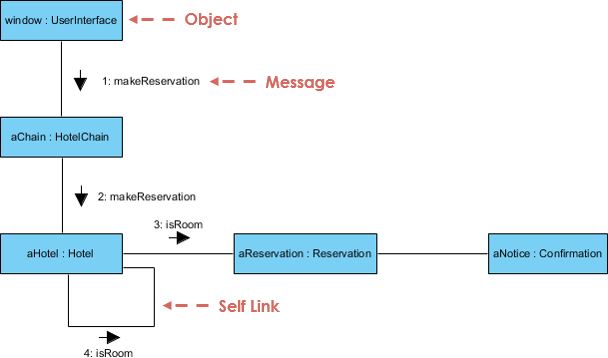
- Communication diagram – A communication diagram shows the interaction between objects and parts in the form of messages, which are represented by lifelines. A communication diagram is a modified form of a UML sequential diagram, but differs from it in that its elements do not need to be horizontally ordered and can have any position in the diagram.
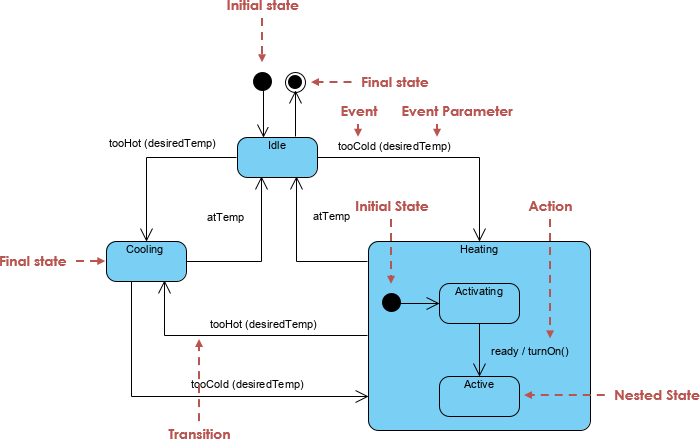
- State Machine Diagram – A state machine diagram describes the state of an entity (device, process, program, software, module, etc.) and the transitions between states. The conditions specify when a transition from one state to another can be used.
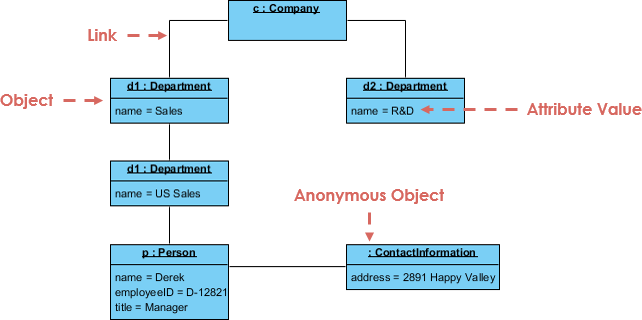
- Object diagram – An object diagram is a structured UML diagram. It describes a system or its parts at a particular time. It models instances, their values and relationships. It can be used to show examples of data structures.
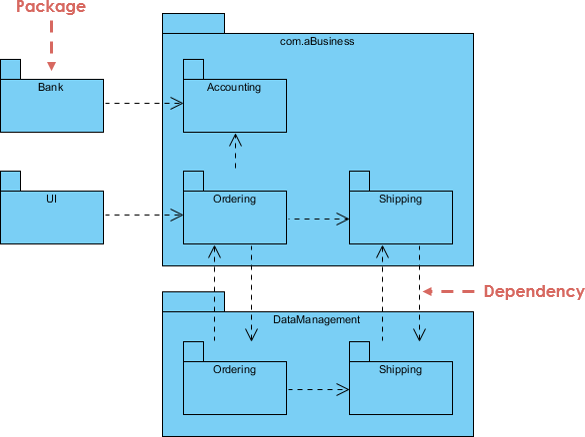
- Package diagram – A package diagram shows the dependencies between packages in a model. It describes the structure and organization of large-scale projects.
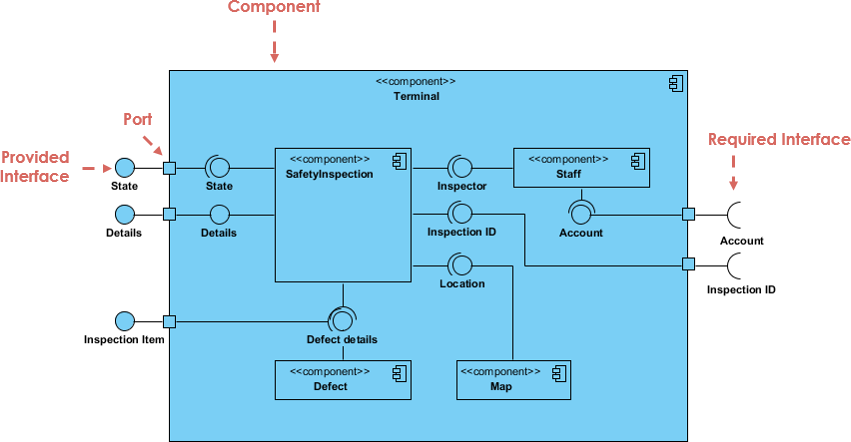
- Component diagram – A component diagram provides a view of a complex system. It describes the interfaces provided and/or required by the various parts of the system and the relationships between the parts. These parts are represented by components and other artifacts.
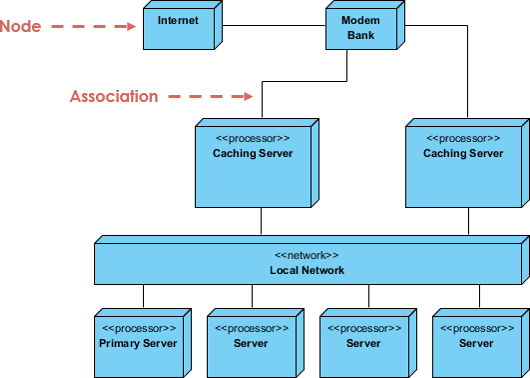
- Deployment Diagram – The deployment diagram describes the deployment of artifacts on a network node. It is used to show the location of artifacts (software, systems, modules, etc.) on physical nodes (hardware, servers, databases, etc.) and the relationships between specific parts of the solution.
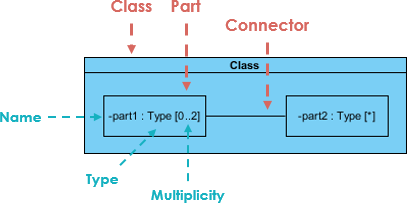
- Composite Structure Diagram – The composite structure diagram shows the internal structure of a classifier, its parts and ports, through which it communicates with its environment. It models collaboration, where each element has its defined role.
- Interaction Overview Diagram – The Interaction Overview Diagram provides a high level view of the interactions in a system or subsystem. It describes processes in a similar way to activity diagrams, but it uses other interaction diagrams and interaction references rather than action nodes.
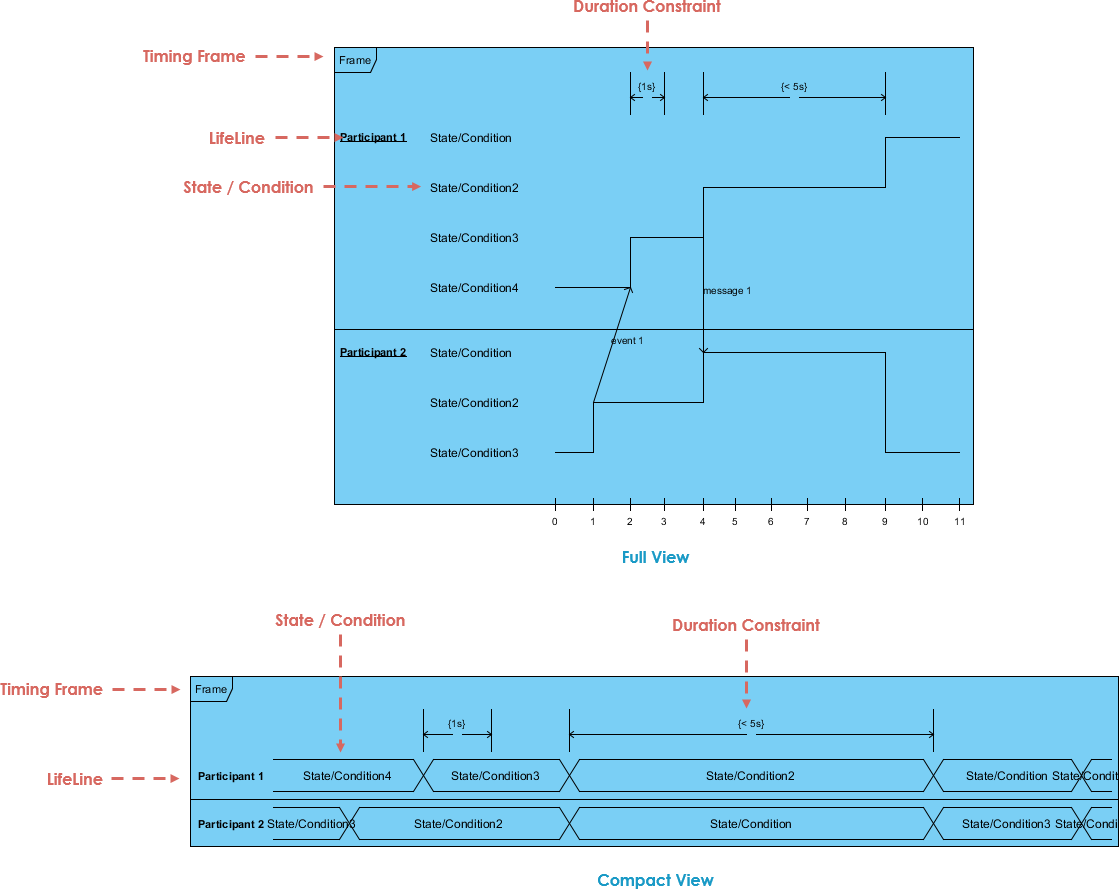
- Timing Diagrams – The timing diagram focuses primarily on time, and it describes the changes in the classifier on a timeline. The timelines are stacked vertically, with time increasing from left to right.
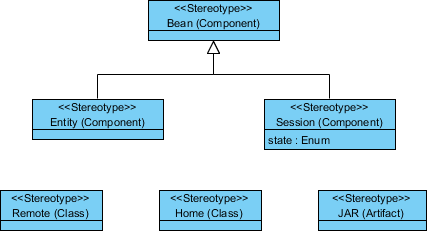
- Profile Diagram – The Profile Diagram describes and defines extensions to the UML language. The extension mechanism allows you to adapt the language to a specific domain or platform. Extensions are defined by stereotyping.
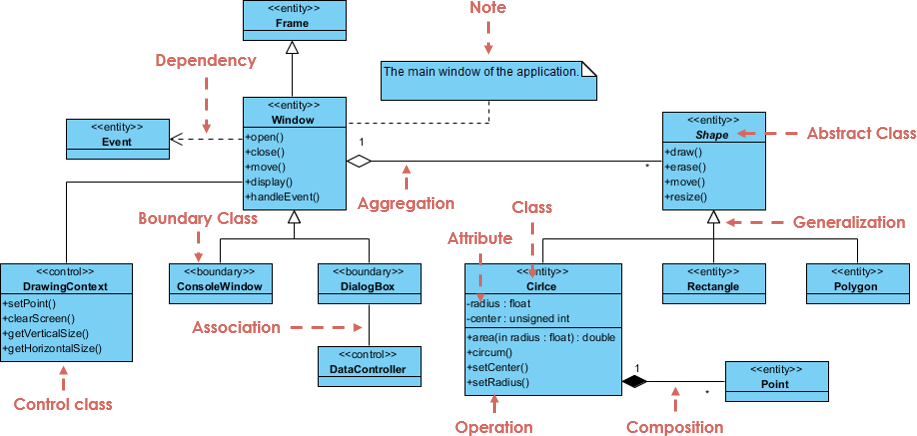
What is a class diagram?
Class diagram is the core modeling tool of all object-oriented methods. Class diagrams describe the types of objects in the system and the various static relationships that exist between them. It is used to represent classes, interfaces, and the static structures and relationships between them.
- Generalization relationship is an inheritance relationship, indicating that a subclass inherits all the features and behaviors of the parent class. A solid line with a triangular arrow, the arrow points to the parent class.
- Realization relationship is a relationship between a class and an interface, indicating that the class is the implementation of all the features and behaviors of the interface. A dotted line with a triangular arrow, the arrow points to the interface.
- Association relationship is an owning relationship, which enables one class to know the properties and methods of another class. A solid line with an ordinary arrow points to the owner. Bidirectional associations can have two arrows, or no arrows. A unidirectional association has an arrow.
- Aggregation relationship is a relationship between a whole and a part. And the part can exist separately from the whole. Aggregation relationship is a kind of association relationship and is a strong association relationship; association and aggregation cannot be distinguished grammatically, and specific logical relationships must be examined. Solid line with hollow diamonds, hollow diamonds point to the whole.
- Composition relationship is a relationship between a whole and a part. But the part cannot exist independently of the whole. It is a kind of association relationship, which is stronger than the aggregation relationship. A solid line with a solid diamond, which points to the whole.
- Dependency relationship is a usage relationship, that is, the implementation of one class requires the assistance of another class. It is a dotted line with ordinary arrows, the ordinary arrows point to the user.
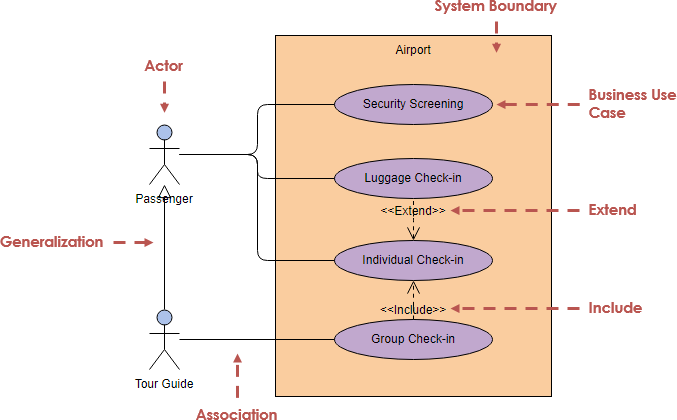
What is a use case diagram?
A use case diagram is a view that describes the functionality of a system composed of actors, use cases, boundaries, and their relationships. It is used to describe the function of the whole system.
The use case diagram contains the following three relationships:
- The include relationship uses the symbol “include”. If you want to view the order list, you need to log in first.
- The extension relationship uses the symbol “extend”. Based on the function of querying the order list, a function of exporting data can be added.
- The generalization relationship, the child use case inherits all the structure, behavior and relationship of the parent use case.
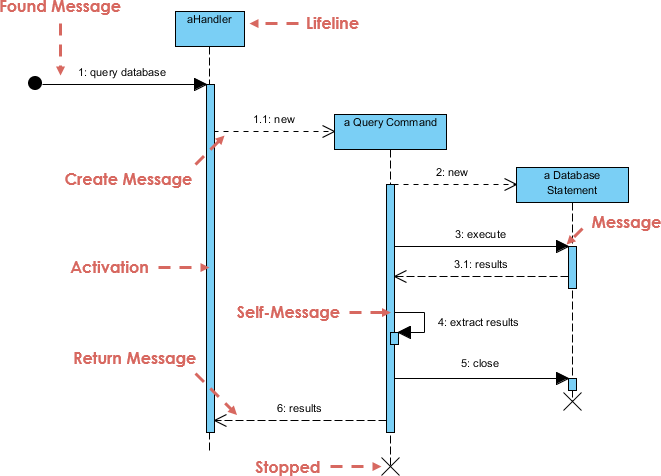
What is a sequence diagram?
- A sequence diagram shows how objects cooperate according to a time series. It shows how objects interact with other objects in a specific scenario of a use case. It shows the dynamic collaboration among multiple objects by describing the time sequence of messages sent between objects.
What is an activity diagram?
Activity diagram describes the implementation process of specific business use cases. It is used to represent the business workflow or use case realization.
What is a Communication Diagram?
Communication diagram describes the organizational relationship of objects that send and receive messages, emphasizing the cooperative relationship between objects rather than chronological order. It is used to display the relationship between different objects.
What is a state machine diagram?
A state machine diagram models the behavior of a single object, indicating the order in which the object executes related events in response to different events throughout its life cycle. It is used to indicate that the specified object responds to different states of different events throughout its life cycle.
What is an object diagram?
An object diagram is an instance of a class diagram, a snapshot of the detailed state of the system at a certain point in time. It is used to express the relationship between two or more objects at a certain moment.
What is a package diagram?
Package diagram, a kind of structural diagram, shows the arrangement and organization of model elements in middle to large scale project. It is used to express the dependencies between packages and packages.
What is a component diagram?
Component diagram describes the interfaces, ports, etc. provided and required by components in the system, as well as the relationship between them. It is used to display the dependencies between components.
What is a deployment diagram?
Deployment diagram describes how the software inside the system is distributed on different nodes. It is used to represent the mapping relationship between software and hardware.
What is a composite structure diagram?
Composite Structure diagram describes the internal structure of a “composite structure” and the relationship between them. This “composite structure” can be part of the system, or a whole. It is used to represent the logical “combination structure” in the system.
What is an interaction overview diagram?
An interaction overview diagram is similar to an activity diagram in that it provides a high level of abstraction for an interaction model. It is a variant of the activity diagram in which the nodes are interactions or situations in which interactions occur. It focuses on outlining the control flow of an interaction and can also show the flow of activity between diagrams.
What is a timing diagram?
A timing diagram is used to show changes in the value or state of one or more elements over time. Also shows the interactions between timed events and the time and deadline constraints that govern them. A view used to represent the state or value of an element that changes over time.
What is a Profile Diagram?
A profile diagram provide a generic extension mechanism for customizing UML models for specific domains and platforms. It is used to build UML models in a specific domain.
UML is Huge and Complex?
UML is a truly a huge topic. UML provides a large volume of diagramming notation grouped into 14 different UML diagram types, each with different UML models, serving different purposes and addressing different aspects of development needs.
- Each UML diagram of the 14 UML diagram types provides a large set of constructs and notation that cover different needs for most of the software development projects.
- UML specification has more than 700 pages, and clearly considered as too complex and has a negative impact on the perception and adoption of UML.
- Typically, users tend to consider and use only a portion of its diagrams/constructs of UML.
Learn the Most Essential UML Diagrams and Notation
Grady Booch, one of the most important developer of Unified Modeling Language, stated that “For 80% of all software only 20% of UML is needed”.
What is the UML Survey* States?
We could interpret the results of the UML survey by assuming that, if a diagram is
- widely used, if it ≥ 60% of the sources
- scarcely used if it is ≤ 40% of the sources
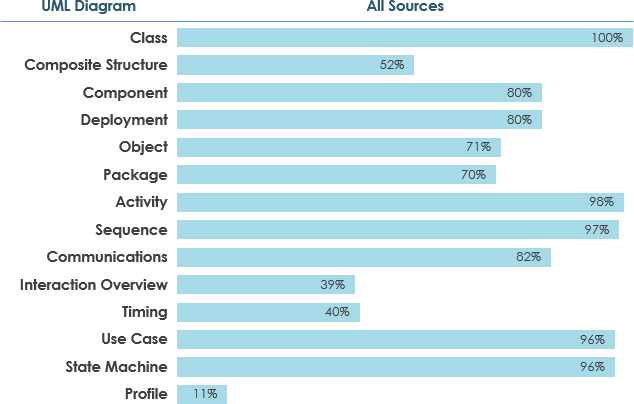
Make Your UML Learning Plan
Based on the figures collected in the survey, you can have a better idea on how to start your UML learning journey by developing a meaningful UML learning plan!
Unified Modeling Language (UML) Resources:
- What is UML?
- Why UML Modeling?
- Overview of the 14 UML Diagram Types
- What is UML Collaboration Diagram?
- UML Association vs Aggregation vs Composition
- UML Class Diagram Tutorial
- How to Model Constraints in UML?
- State Machine Diagram vs Activity Diagram
- How to Identify Actors?
- Types of Actor in Use Case Model
- What is Model-View and Control?
- How to Model MVC Framework with UML Sequence Diagram?
- UML – Behavioral Diagram vs Structural Diagram
- What is UML Extensibility Mechanism?
- UML Practical Guide – All you need to know about UML modeling
- UML Modeling, Software Process and Tool
- UML – Modeling Software Architecture with Packages
- All You Need to Know about State Diagrams
This post is also available in Deutsch, Español, فارسی, Français, English, Bahasa Indonesia, 日本語, Polski, Portuguese, Ру́сский, Việt Nam, 简体中文 and 繁體中文.