


Introduction
Welcome to the AI-Powered Business Process Management platform—a cutting-edge tool designed to streamline how you document, visualize, and analyze business workflows. This AI-driven solution transforms simple textual descriptions into structured, actionable diagrams, reports, and insights, eliminating the need for time-consuming manual diagramming and documentation. Whether you’re dealing with customer complaints, project planning, or process optimization, the platform empowers users to create efficient workflows in minutes.
The platform’s core philosophy is to make complex business processes accessible and insightful. By leveraging artificial intelligence, it automates process discovery, design, and analysis, allowing teams to focus on execution and improvement rather than setup. This guide combines information from the product overview and an example app workflow (demonstrated through a “Handling a Customer Complaint” process) to provide a complete understanding of its capabilities.

Key benefits include:
- Speed: Turn ideas into workflows instantly.
- Clarity: Visual diagrams and narratives make processes easy to understand.
- Insights: AI-generated reports for data-driven decisions.
- Collaboration: A single source of truth for teams.
To get started, visit the platform’s website or sign up for a trial via the “Try It Now” button.
Key Features
The platform offers a suite of AI-powered tools to handle every stage of business process management. Here’s a breakdown of the main features:
1. AI-Powered Process Discovery
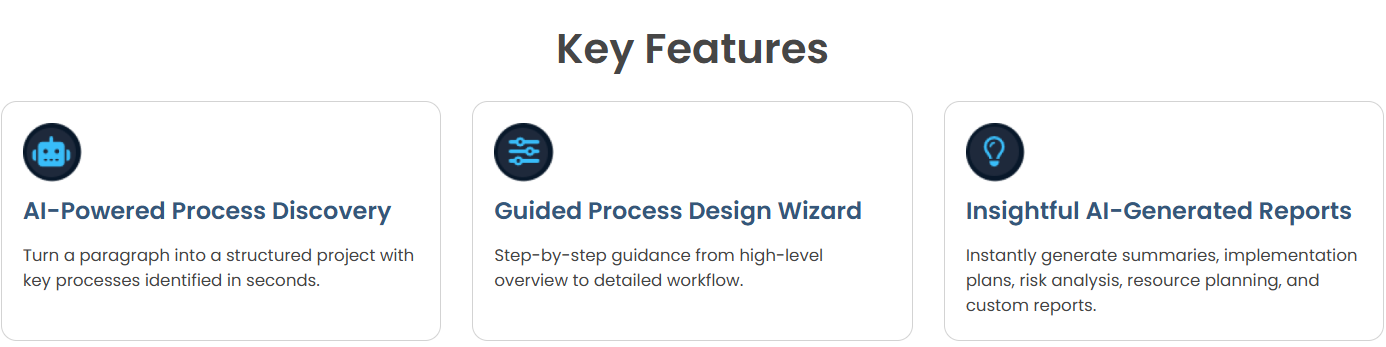
- Description: Input a simple paragraph describing your business challenge or workflow, and the AI automatically identifies key processes, stakeholders, and steps. This feature breaks down unstructured text into a structured project outline in seconds.
- How It Works: Start with a high-level description (e.g., a problem statement like inconsistent customer complaint handling). The AI parses it to generate an initial process framework, including goals, scope, and potential inefficiencies.
- Example: For “Customer complaints are handled inconsistently via email,” the AI might output a structured overview highlighting issues like slow response times and lack of tracking.
2. Guided Process Design Wizard
- Description: A step-by-step interface that guides you from a high-level overview to a detailed workflow. It includes tabs for Overview, Interactions, Visualize, KPIs, and Reports.
- How It Works:
- Overview Tab: Define the core “why” of your process with a problem statement or summary. This sets the strategic context.
- Interactions Tab: Build a sequential narrative of who does what. Describe steps in plain language, and the AI refines it into a clear story.
- Visualize Tab: Automatically generates a visual diagram from your interaction story, showing flows between stakeholders (e.g., swimlane diagrams with arrows indicating actions like “submits complaint” or “assigns ticket”).
- KPIs Tab: Define and track Key Performance Indicators (KPIs) with targets, such as response times or resolution rates.
- Example: In the “Handling a Customer Complaint” workflow:
- Overview: Highlights the problem of inconsistent email handling leading to lost information.
- Interactions: A numbered list of steps (e.g., 1. Customer submits complaint, 2. Ticket created, etc.).
- Visualize: A diagram with stakeholders like “Customer,” “Support Agent,” “Ticketing System,” and flows like “submits,” “assigns,” “investigates.”
3. Insightful AI-Generated Reports
- Description: Use AI to analyze your process from various perspectives. Generate custom reports on summaries, implementation plans, risk assessments, resource needs, and more.
- How It Works: Navigate to the Reports tab to select or customize report types. The AI pulls from your process data to produce detailed, actionable outputs.
- Example Reports:
- Summary Report: High-level overview of the process, including key stakeholders and workflow.
- Implementation Plan: Step-by-step guide to rolling out the process.
- Risk Analysis: Identifies potential bottlenecks, like delays in ticket assignment.
- Resource Planning: Estimates needed tools, personnel, and time.
- Navigation Tip: From the Summary tab, scroll or use left-side navigation to jump to Reports. Reports can be exported for sharing.
Additional features include:
- View & Edit Functionality: Available on every section for real-time adjustments.
- Stakeholder Visualization: Diagrams show interactions between roles (e.g., Customer → Ticketing System → Support Agent).
- Performance Tracking: KPIs are quantifiable, with targets like “First Response Time < 4 hours.”
Who It’s For
This platform is tailored for professionals who need to manage, optimize, or document business processes efficiently. Here’s how it benefits specific roles:
Business Analysts
- Rapidly document current-state and future-state processes.
- Convert textual descriptions into structured workflows, diagrams, and reports.
- Gain actionable insights without manual effort, enabling faster analysis.
Project Managers
- Define project scope and create detailed implementation plans.
- Track progress with integrated KPIs and visual flows.
- Ensure team alignment by providing a clear, shared understanding of roles and steps.
Process Improvement Consultants
- Identify inefficiencies, risks, and bottlenecks in workflows.
- Use AI diagrams and reports to deliver data-backed recommendations.
- Optimize client operations with custom analyses, such as risk assessments or resource plans.
It’s ideal for any team or individual in operations, consulting, or management looking to transform ideas into executable processes.
Getting Started
- Sign Up: Access the platform via the website. Click “Try It Now” for a free trial or demo.
- Create a New Process:
- Enter a process name (e.g., “Handling a Customer Complaint”).
- Provide an initial description or problem statement.
- Navigate the Dashboard:
- Use the left-side menu: Overview, Interactions, Visualize, KPIs, Reports.
- Scroll through sections or jump directly.
- Input Data:
- Start with the Overview: Write or edit the problem statement.
- Move to Interactions: List steps sequentially.
- Generate Visuals and Insights:
- The AI auto-generates diagrams and suggests KPIs.
- Head to Reports for in-depth analyses.
- Edit and Iterate: Use “View & Edit” buttons to refine any section. Changes propagate across tabs (e.g., updating steps refreshes the diagram).
Tips:
- For complex processes, start broad and add details iteratively.
- If your input is a paragraph, let the AI handle initial structuring.
- Export reports or diagrams for presentations.
Step-by-Step Usage Example: Handling a Customer Complaint
This example walks through creating and analyzing a sample process based on the provided app description.
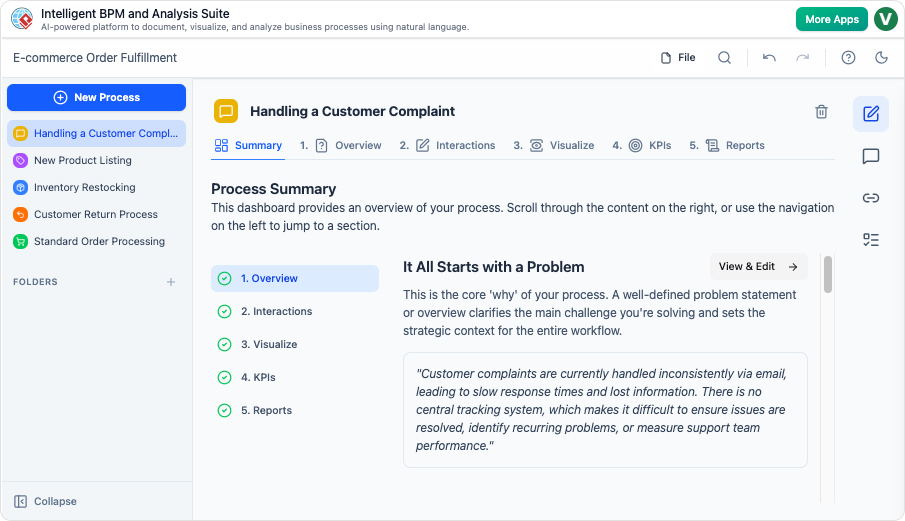
Step 1: Define the Overview
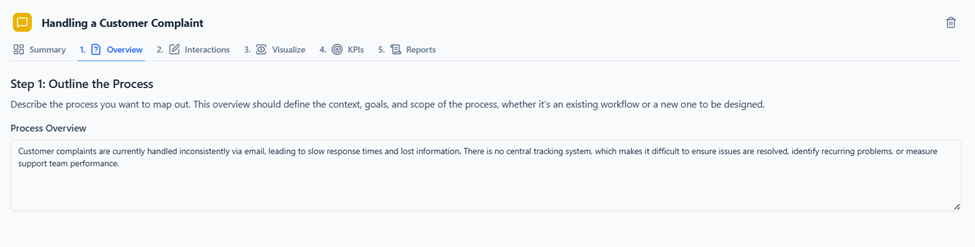
- Problem Statement: “Customer complaints are currently handled inconsistently via email, leading to slow response times and lost information. There is no central tracking system, which makes it difficult to ensure issues are resolved, identify recurring problems, or measure support team performance.”
- Purpose: This clarifies the “why” and sets context.
Step 2: Outline Interactions
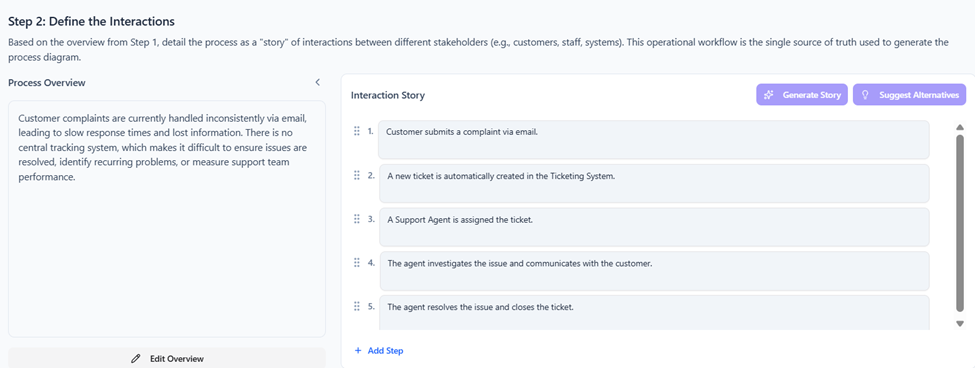
- Break down into a narrative:
- Customer submits a complaint via email.
- A new ticket is automatically created in the Ticketing System.
- A Support Agent is assigned the ticket.
- The agent investigates the issue and communicates with the customer.
- The agent resolves the issue and closes the ticket.
- AI Assistance: The platform ensures this serves as the “single source of truth.”
Step 3: Visualize the Process
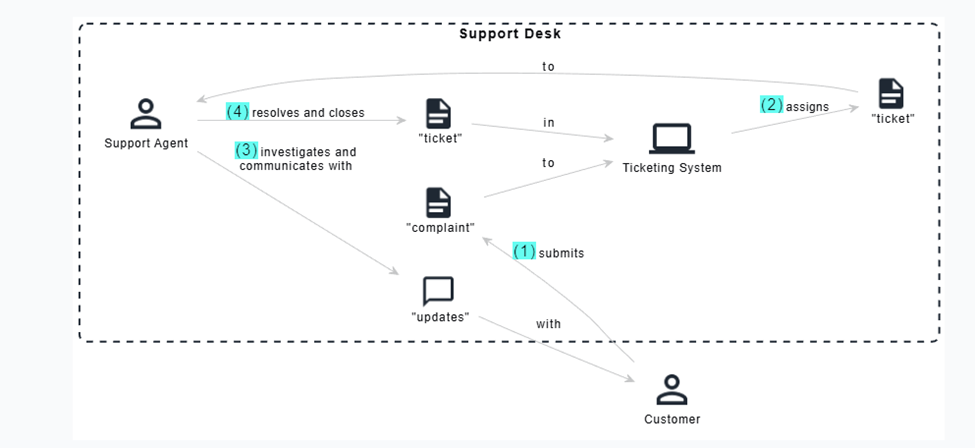
- Diagram Generation: The interaction story is transformed into a visual flow.
- Stakeholders: Customer, Support Agent, Ticketing System, Support Desk.
- Flows: Arrows show actions like “submits complaint,” “creates ticket,” “assigns,” “investigates and communicates,” “resolves and closes.”
- Benefit: Makes complex interactions glanceable.
Step 4: Set KPIs
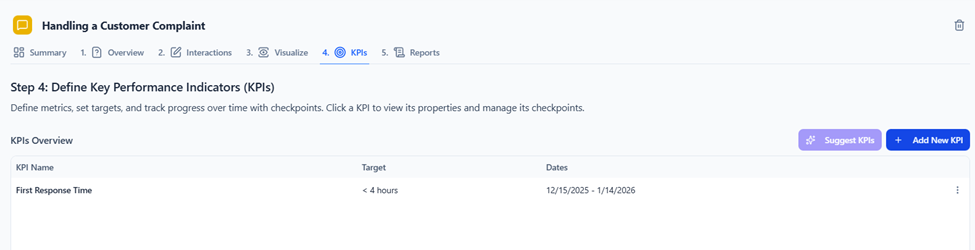
- Examples:
- First Response Time (Target: < 4 hours).
- Tracking: Monitor efficiency against targets.
Step 5: Generate Reports
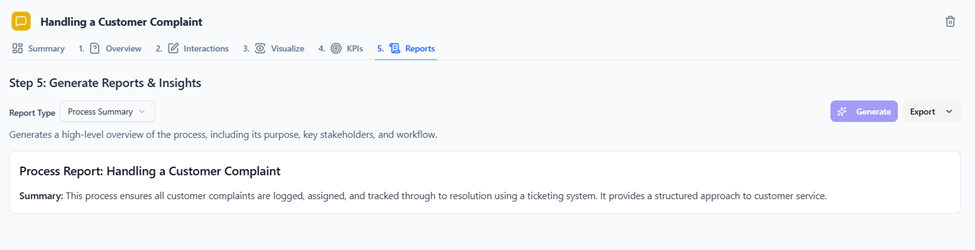
- Navigate to Reports.
- Select types: Summaries, implementation plans, risk assessments.
- Example Output: A report might detail potential risks like “delayed assignments” and suggest mitigations.
Advanced Tips and Best Practices
- Customization: Use the AI to generate custom reports by specifying angles (e.g., “focus on risks”).
- Integration: Diagrams and reports can be exported for use in tools like Microsoft Office or project management software.
- Collaboration: Share processes with teams for feedback.
- Troubleshooting: If a diagram doesn’t generate correctly, refine your interaction steps for clarity.
- Scalability: Handle simple or complex workflows—start with one process and expand.
Conclusion
The AI-Powered Business Process Management platform revolutionizes how businesses handle workflows, saving hours on documentation and providing deep insights for optimization. By combining AI discovery, guided design, and analytical reports, it empowers users to make informed decisions quickly. Whether you’re a business analyst documenting processes, a project manager planning executions, or a consultant identifying improvements, this tool turns your ideas into actionable realities.
Ready to transform your processes? Click “Try It Now” on the platform’s site and start building today. For support, refer to in-app help or contact the team.
This post is also available in Deutsch, Español, فارسی, Français, English, Bahasa Indonesia, 日本語, Polski, Portuguese, Ру́сский, Việt Nam, 简体中文 and 繁體中文.