
Introduction
In today’s fast-paced business environment, clarity is king. Whether you’re designing a complex software algorithm, mapping out a customer service workflow, or optimizing a manufacturing process, the ability to visualize steps clearly can make the difference between success and confusion. This is where flowcharts come in.
A flowchart is more than just a diagram; it is a universal language of logic and process. Originating from computer science as a tool for representing algorithms, flowcharts have evolved into essential instruments for business analysis, project management, and operational efficiency. They help teams visualize complex processes, identify bottlenecks, and ensure everyone shares a common understanding of how work gets done.
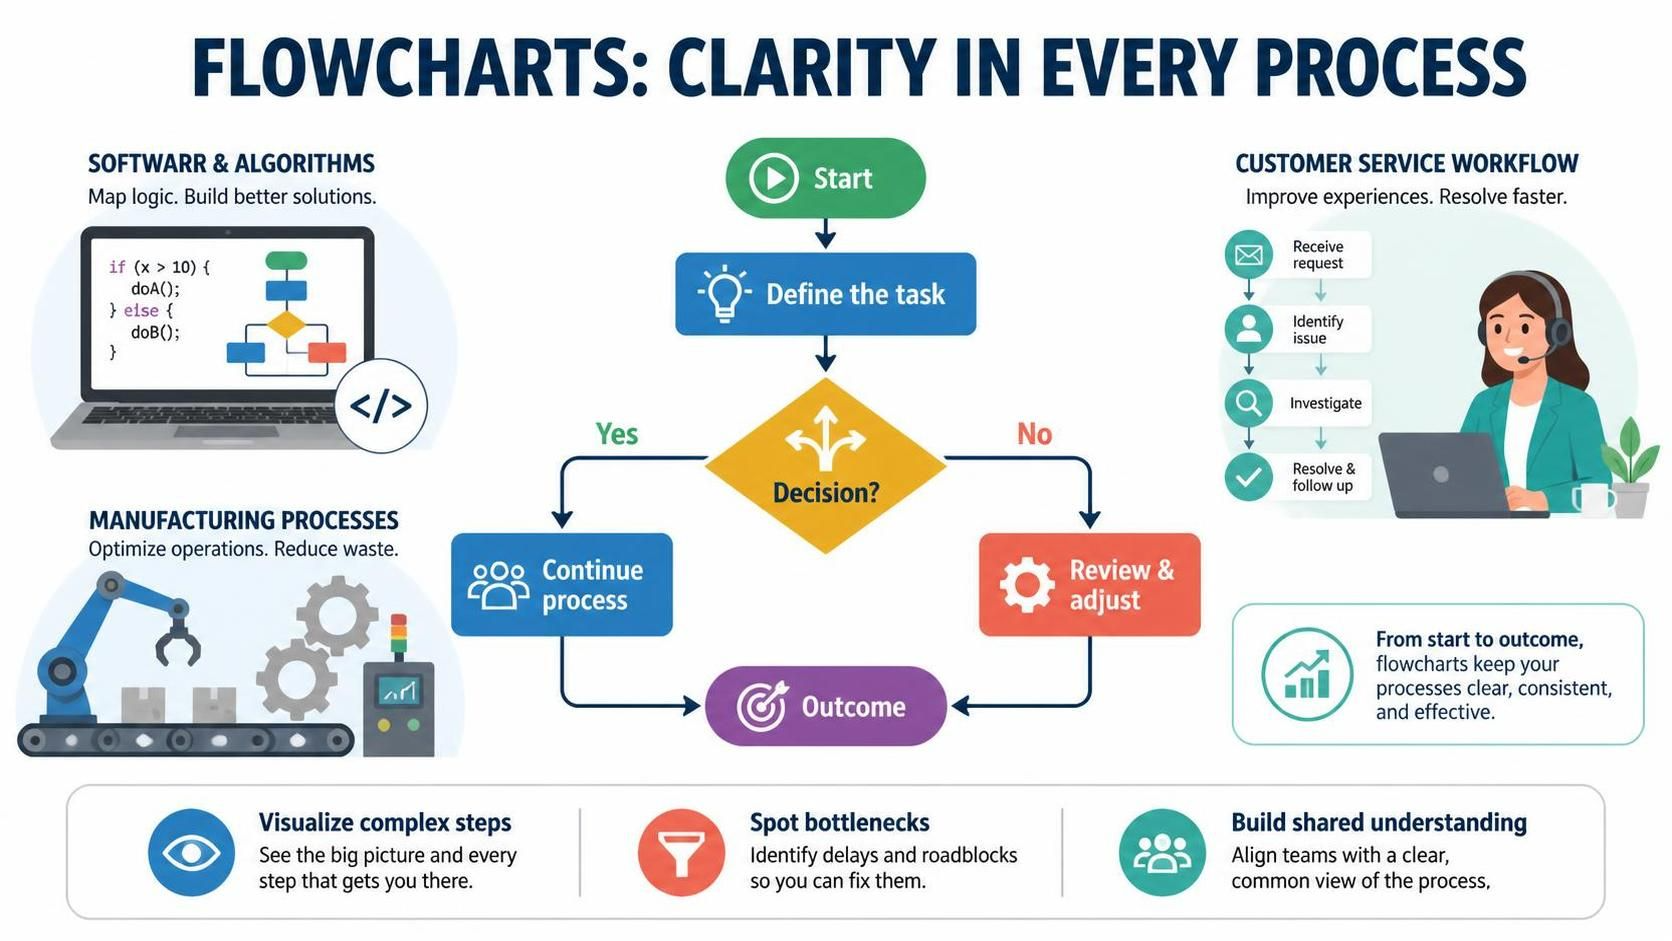
This comprehensive guide will walk you through everything you need to know about flowcharts—from fundamental symbols and best practices to practical examples. We will also explore how to leverage Visual Paradigm, a powerful diagramming tool, to create professional, impactful flowcharts with ease.
What is a Flowchart?
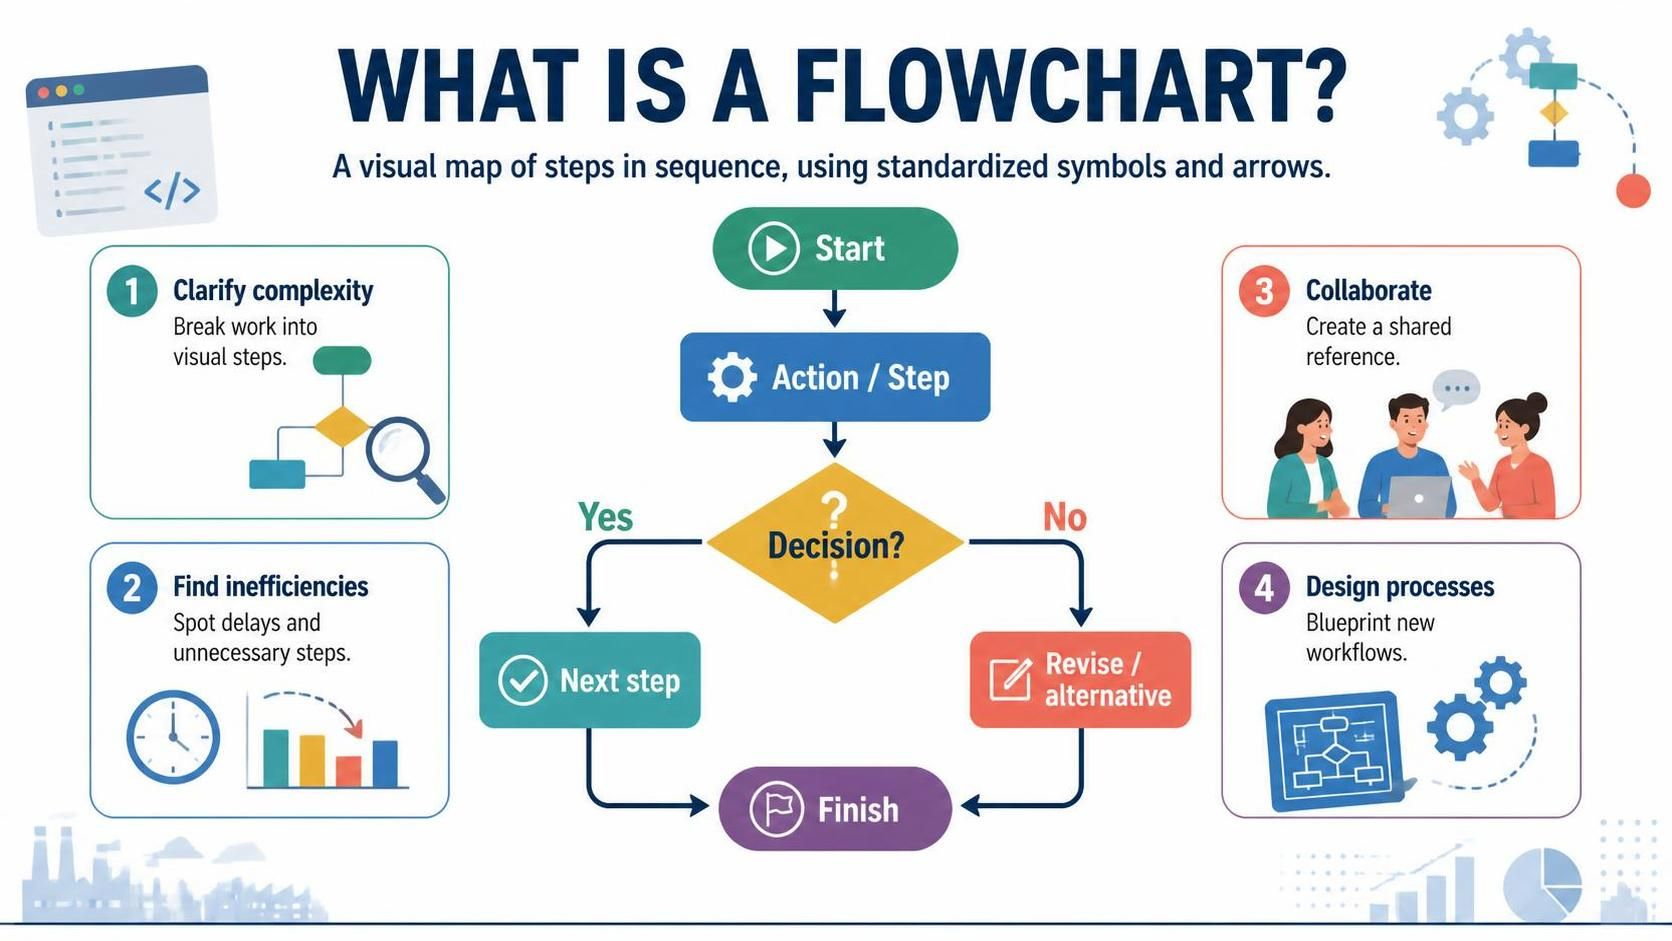
At its core, a flowchart is a graphical representation of steps in a sequential order. It uses standardized shapes to represent different types of actions or decisions, connected by arrows that indicate the direction of flow.
While initially developed for programming logic, flowcharts are now used across virtually every industry. They serve multiple critical functions:
-
Clarifying Complexity: Breaking down intricate processes into manageable, visual steps.
-
Identifying Inefficiencies: Highlighting delays, redundant steps, unnecessary storage, or communication breakdowns.
-
Facilitating Collaboration: Providing a shared visual reference that helps team members align on processes, collect data, and identify resources.
-
Designing New Processes: Serving as a blueprint for implementing new workflows or projects.
Key Concepts: Understanding Flowchart Symbols
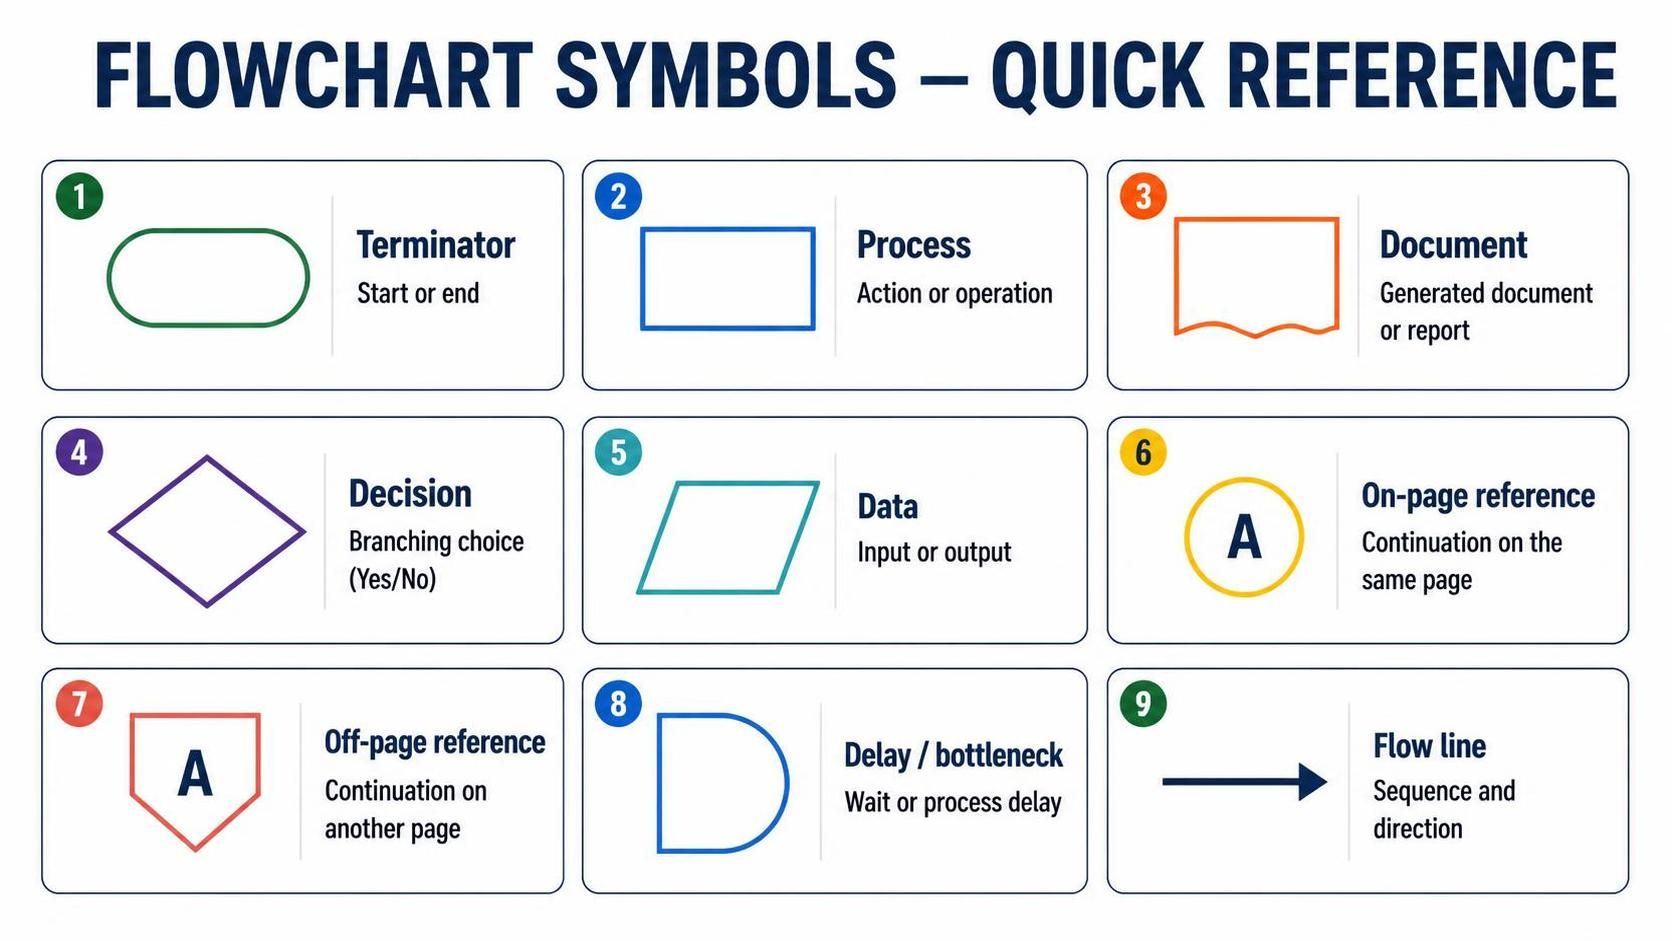
To read or create a flowchart effectively, you must understand the conventional meanings of its shapes. Using the correct symbol ensures your diagram is universally understood.
Terminator
The terminator symbol represents the starting or ending point of the system. It is typically an oval or rounded rectangle.

Process
A rectangle indicates a specific operation, action, or step within the process. This is the most common shape in any flowchart.

Document
This symbol represents a printout, such as a physical document, report, or form generated during the process.

Decision
A diamond represents a decision point or branching logic. Lines emerging from the diamond indicate different possible outcomes (e.g., Yes/No, True/False), leading to different sub-processes.

Data
This parallelogram shape represents information entering or leaving the system. An input might be a customer order, while an output could be a delivered product or generated report.

On-Page Reference
When a flowchart becomes too large for one section of a page, this symbol (containing a letter) indicates that the flow continues at another matching symbol with the same letter on the same page.

Off-Page Reference
Similar to the on-page reference, this symbol indicates that the flow continues on a different page. It contains a letter that matches the corresponding symbol on the other page.

Delay or Bottleneck
This symbol identifies a point in the process where a delay occurs or where a bottleneck exists, helping teams focus on areas for improvement.

Flow
Lines with arrows represent the sequence and direction of the process, connecting all shapes and guiding the reader through the logic.

FlowChart Notation Summary
When to Draw a Flowchart?
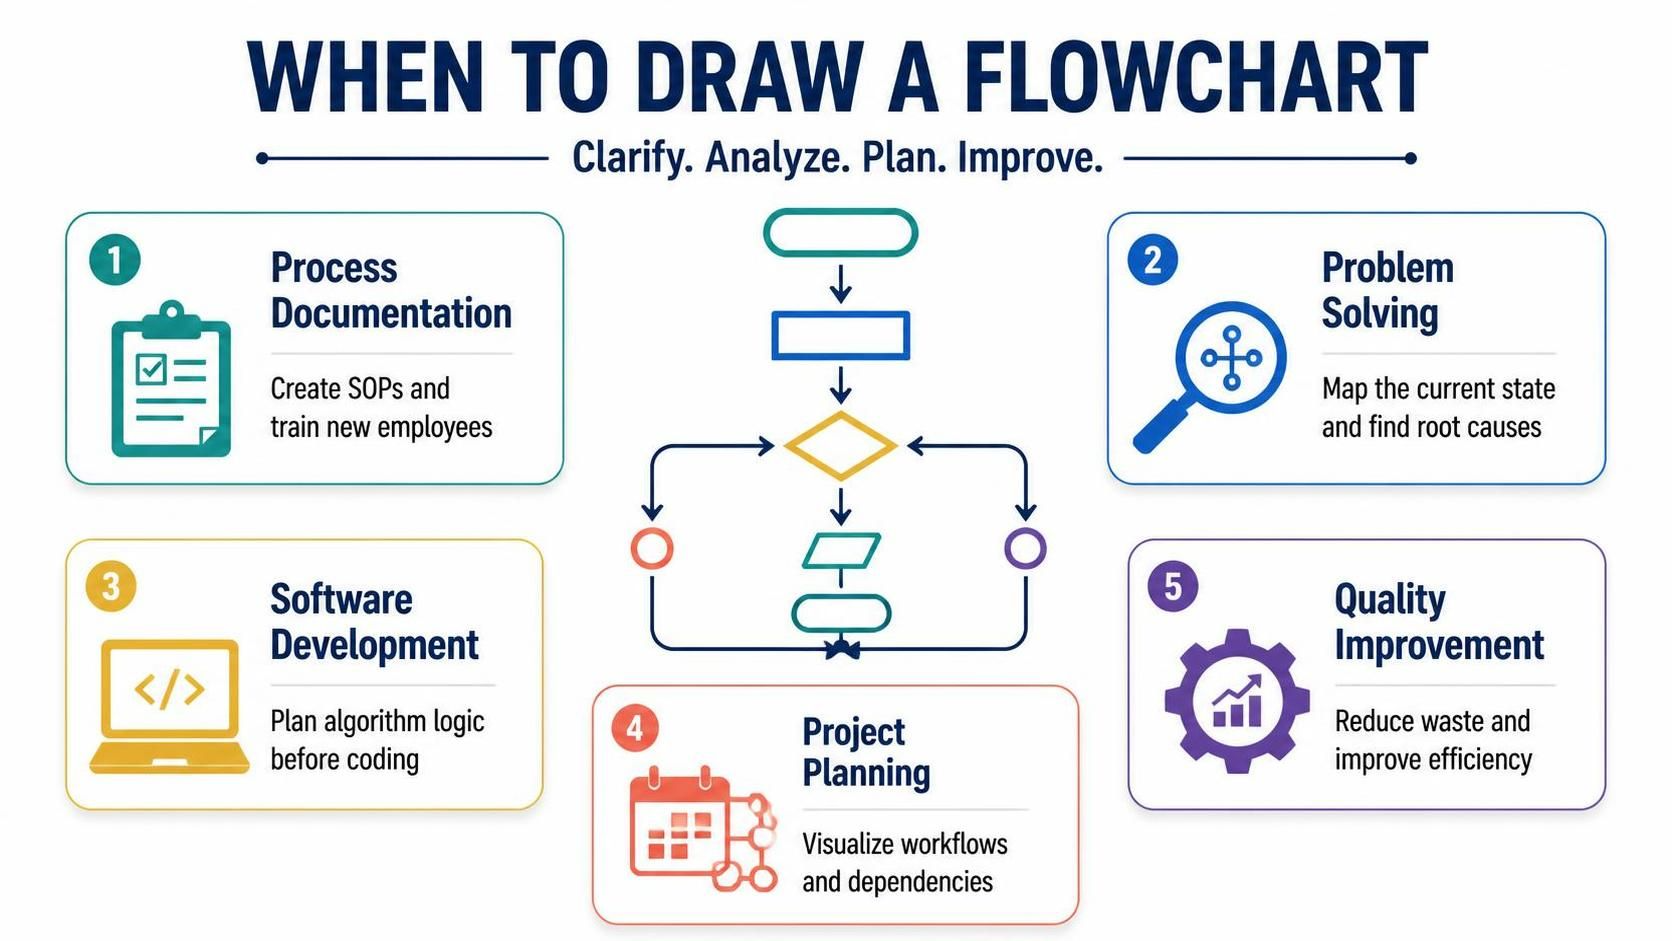
Flowcharts are versatile tools applicable in numerous scenarios:
-
Process Documentation: Creating standard operating procedures (SOPs) for training new employees.
-
Problem Solving: Mapping out current states to identify root causes of issues.
-
Software Development: Designing algorithm logic before writing code.
-
Project Planning: Visualizing project workflows and dependencies.
-
Quality Improvement: Analyzing processes to eliminate waste and improve efficiency.
Flowchart Examples in Practice
Seeing flowcharts in action helps illustrate their practical value. Here are several real-world examples.
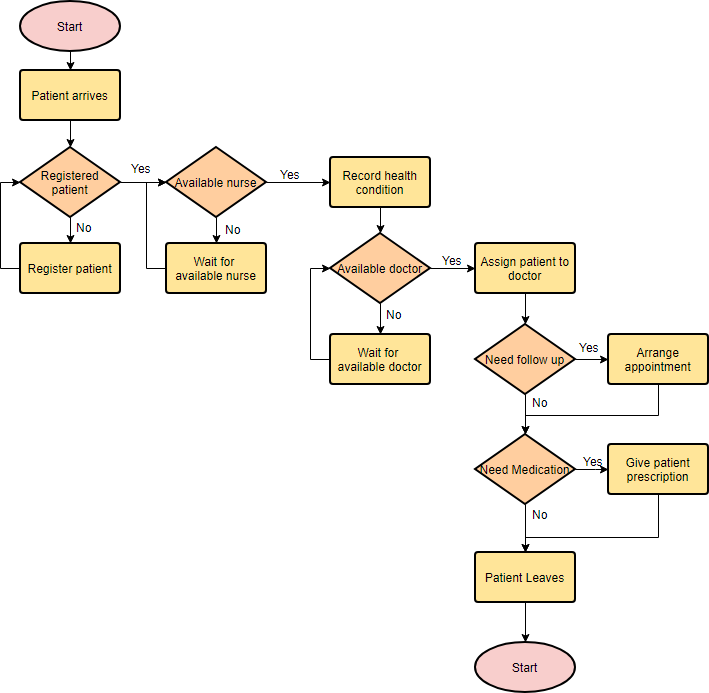
Flowchart Example – Medical Service
This hospital flowchart demonstrates how clinical cases are processed. Notice the intensive use of decision shapes to represent alternative paths based on patient conditions, ensuring proper triage and treatment.
Flowchart Example – Simple Algorithms
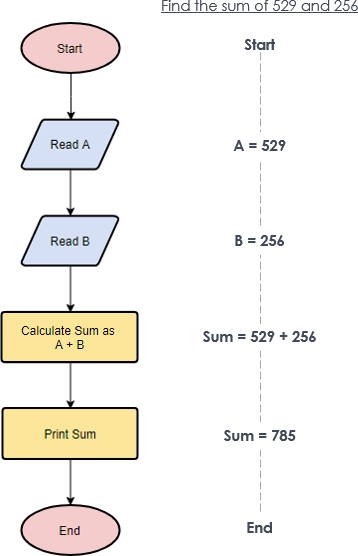
Flowcharts are excellent for visualizing algorithms, regardless of complexity. This example shows a simple summation process, breaking down logical steps clearly for developers or stakeholders.
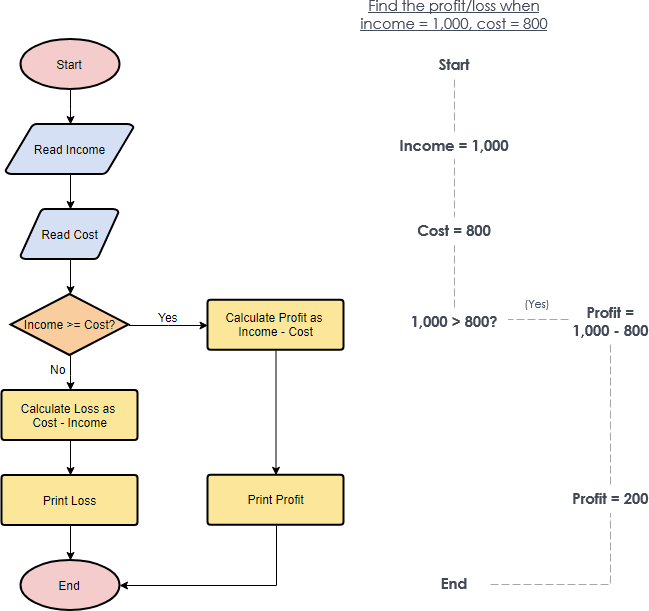
Flowchart Example – Calculate Profit and Loss
Business processes benefit greatly from flowcharts. This example outlines the steps involved in calculating profit and loss, making financial logic transparent and easy to follow.
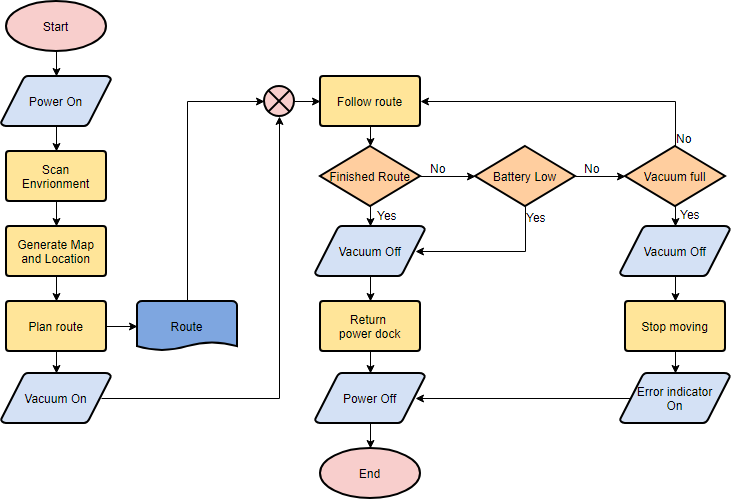
General Flowchart Example
Below is a classic example showing how various symbols work together to represent a complete workflow.
Tooling: Visual Paradigm
Creating professional flowcharts doesn’t have to be complicated. Visual Paradigm offers an intuitive, powerful platform for designing diagrams that communicate clearly and look polished. Here’s how to create a flowchart using Visual Paradigm.
Step-by-Step Guide to Creating a Flowchart
Let’s walk through creating a simple e-commerce checkout flowchart.
-
Start a New Diagram: Select Diagram > New from the main menu.
-
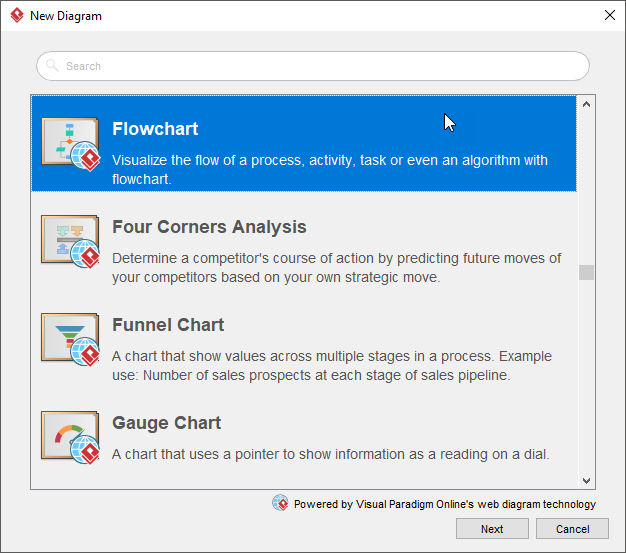
Choose Flowchart: In the New Diagram window, select Flowchart and click Next.
-
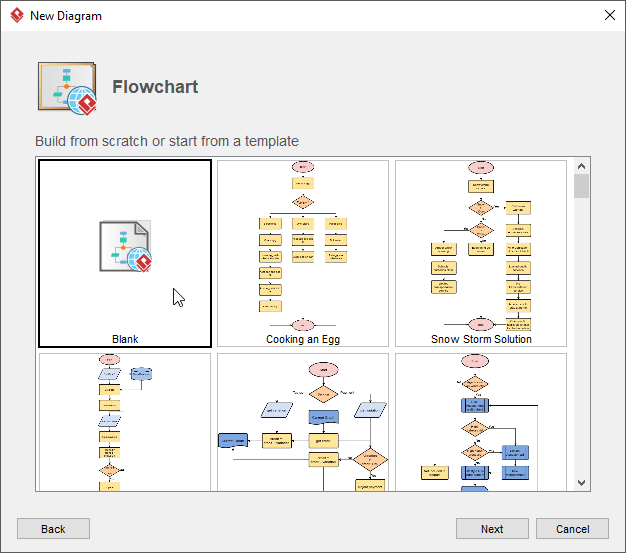
Select Template: You can start from an empty diagram, a template, or an example. For this tutorial, select Blank and click Next.
-
Name Your Diagram: Enter a name for your flowchart (e.g., “Checkout Process”) and click OK.
-
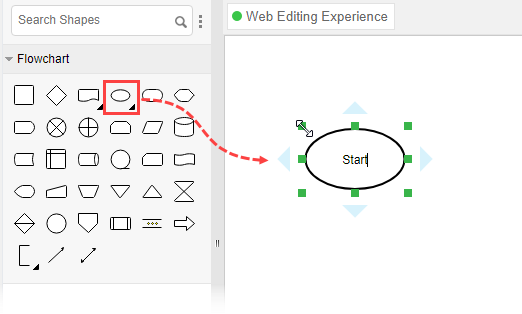
Add the Start Symbol: Drag the Start shape from the diagram toolbar and drop it onto the canvas. Name it Start.
-
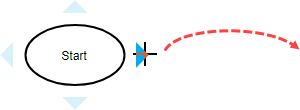
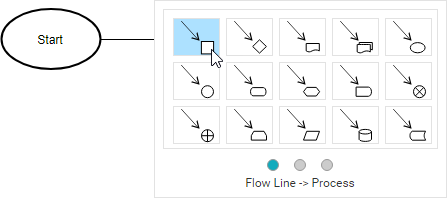
Create the Next Shape: Hover your mouse over the start shape. Press and drag the triangular handler on the right side outward.
-
Select Process Type: Release the mouse button. From the Resource Catalog that appears, select Flow Line > Process.
-
Label the Process: Enter Add items to Cart as the name of the process step.
-
Continue Building: Follow the same steps to create two more process steps: Checkout Shopping Cart and Settle Payment.

-
End the Flow: Create a terminator shape to mark the end of the process.
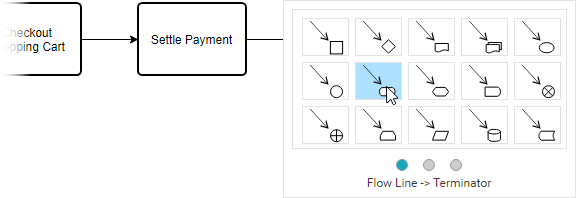
Your basic diagram should now look like this:

-
Format and Style: To enhance readability and visual appeal, color your shapes. Select Diagram > Format Panel from the main menu. Choose a shape, then update its color via the Style settings in the Format Panel.
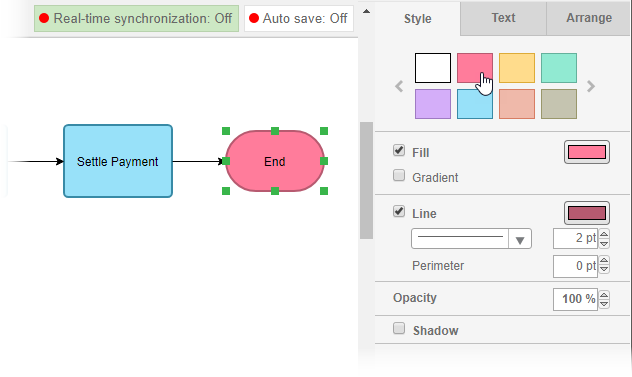
Here is the final, polished flowchart:

Visual Paradigm’s intuitive drag-and-drop interface, combined with smart connectors and formatting options, makes it easy to create clear, professional diagrams quickly.
Conclusion
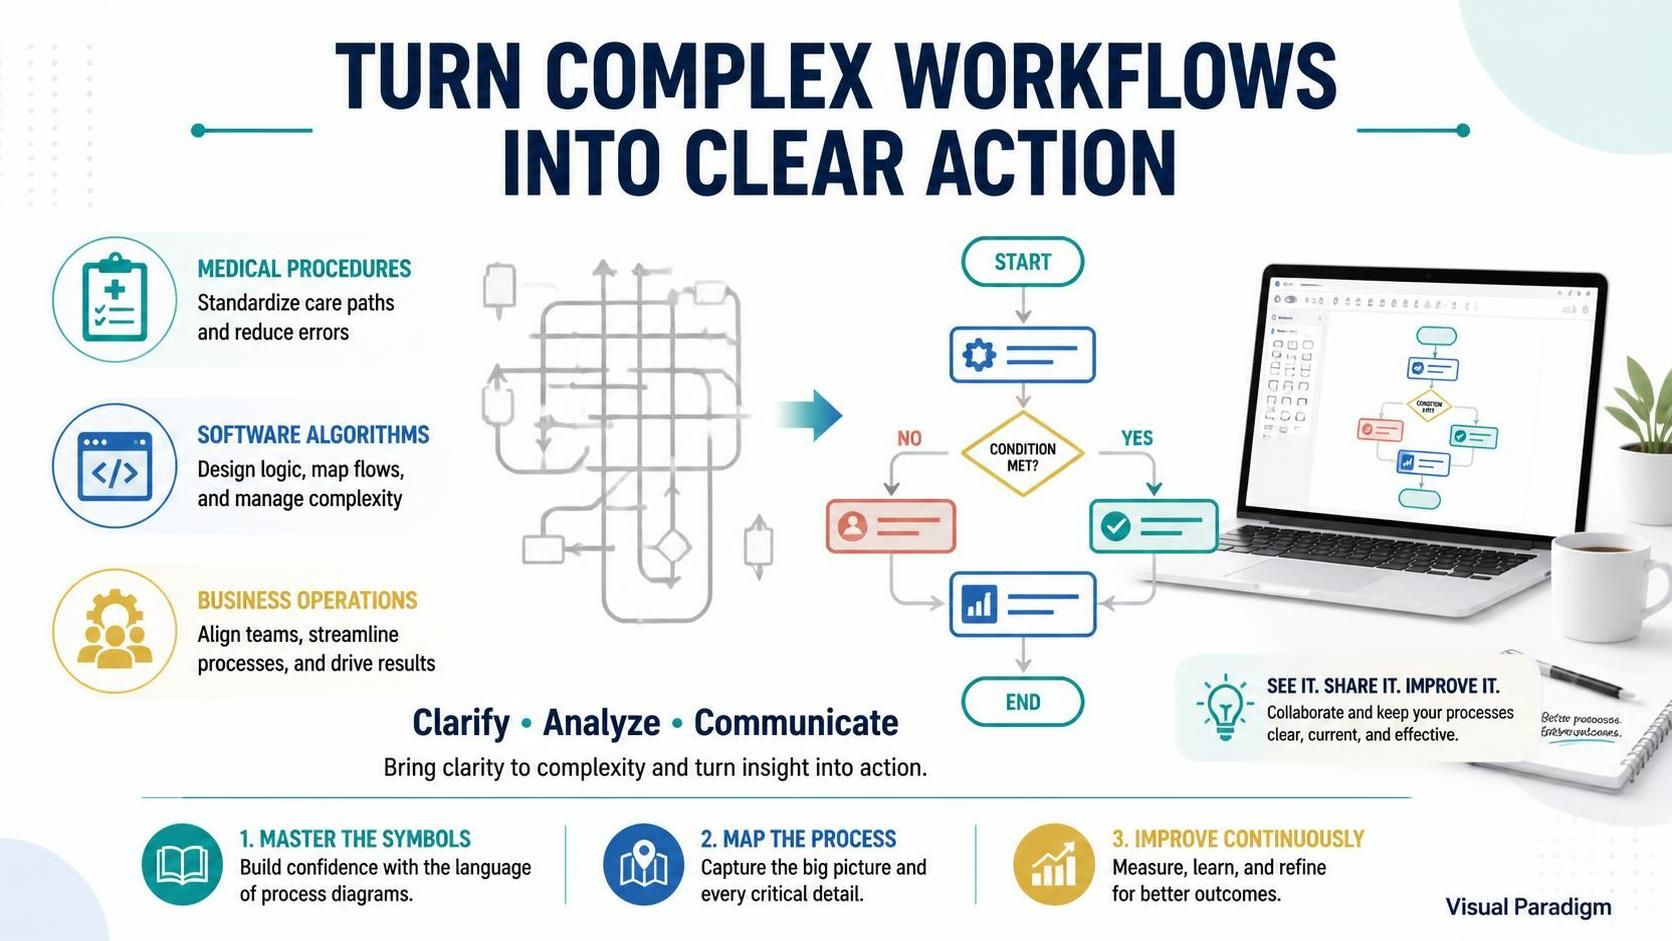
Flowcharts are indispensable tools for anyone looking to clarify, analyze, or communicate processes. By mastering the standard symbols and understanding when to apply them, you can transform complex workflows into clear, actionable visuals. Whether you’re documenting a medical procedure, designing an algorithm, or streamlining a business operation, flowcharts provide the structure needed for effective collaboration and continuous improvement.
With powerful tools like Visual Paradigm, creating these diagrams becomes a seamless part of your workflow. Start mapping your processes today, and unlock greater clarity, efficiency, and success in your projects.
Recommended Reading: Visual Paradigm Resources
-
Flowchart Tutorial (with Symbols, Guide and Examples): A comprehensive beginner’s guide covering flowchart symbols, use cases, and step-by-step creation in Visual Paradigm.
-
Master Mermaid Flowcharts for Business Logic and Product Workflows: Guide to creating text-based flowcharts using Mermaid syntax for version-controlled business logic modeling.
-
Visual Paradigm Flowchart Creator: Release announcement detailing enhanced flowchart editor with built-in validation and integration capabilities.
-
Introducing Stepwise Flowchart: AI-Powered Process Mapping: Overview of AI-driven stepwise flowchart feature that organizes complex processes into structured phases.
-
Create a Flowchart in a Presentation: Tutorial on designing and styling flowcharts within VP Online presentations.
-
Visual Paradigm Online for Office: Microsoft Office add-in enabling embedding of editable flowcharts into Word and PowerPoint documents.
-
Information Flow Diagram Software: Feature overview of Visual Paradigm’s flowchart and information flow diagram capabilities.
-
AI Flowchart Generator for Support Ticket Workflows: Guide demonstrating AI-powered flowchart generation from text descriptions for customer support processes.