


Introduction
Overview
UML 2.0 organizes diagrams into two primary categories:
| Category | Purpose |
|---|---|
| Structural Diagrams | Capture the physical organization of elements—how objects relate to one another |
| Behavioral Diagrams | Focus on how elements interact, change state, and process behavior over time |
💡 Key Principle: A UML model consists of one or more diagrams. Each diagram represents a particular view or interest in the system being modeled. Individual elements often appear across multiple diagrams.
🔷 Structural Diagrams
Structural diagrams model the static architecture of your system—the “what” rather than the “how.”
1. Class Diagrams
Purpose: Model classes, interfaces, and their static relationships.
Key Elements:
-
Classes with attributes and operations
-
Interfaces and realization relationships
-
Associations, aggregations, compositions, and generalizations
-
Visibility modifiers (
+,-,#,~) -
Multiplicity specifications (
1,0..*,1..5)
Example Use:When to Use:
Class Stereotypes and Types
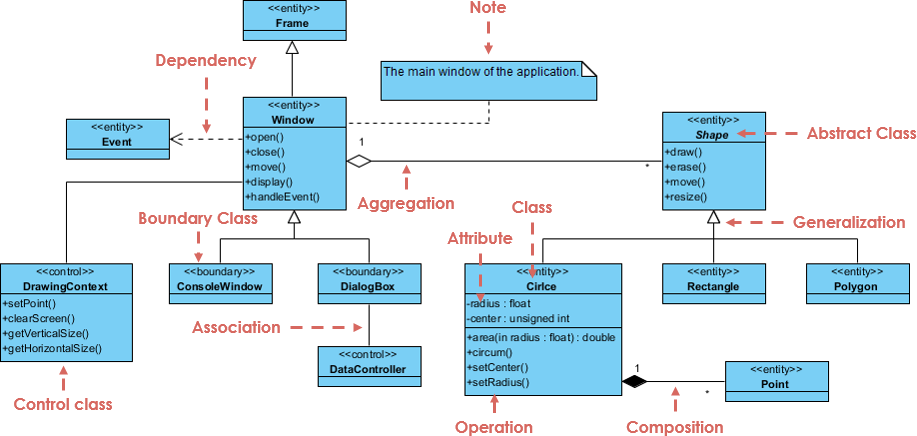
The diagram uses stereotypes (indicated by text inside chevron brackets, like <<entity>>) to categorize the role of each class:
-
Boundary Classes (
<<boundary>>): These handle the interaction between the system and its actors (users or external systems). -
Examples:
ConsoleWindowandDialogBox. -
Control Classes (
<<control>>): These manage the coordination, transactions, and business logic flow of the application. -
Examples:
DrawingContextandDataController. -
Entity Classes (
<<entity>>): These represent the core data or persistent information the system tracks. -
Examples:
Frame,Window,Event,Shape,Circle,Rectangle,Polygon, andPoint. -
Abstract Class: The
Shapeclass represents an abstract concept. It serves as a base blueprint for specific shapes and cannot be instantiated directly on its own.
Anatomy of a Class
A standard UML class box is split into compartments. Looking at the Circle class as an example:
-
Class Name: Located in the top compartment (
Circle). -
Attributes: Located in the middle compartment, representing the data fields.
-
-radius : float(The minus sign-indicates a private attribute). -
-center : unsigned int -
Operations (Methods): Located in the bottom compartment, representing the behaviors or functions.
-
+area(in radius : float) : double(The plus sign+indicates a public method). -
+circum(),+setCenter(), and+setRadius().
Relationships and Links
The lines and arrows connecting the classes define how they interact and depend on one another:
Generalization (Inheritance)
Represented by a solid line with an hollow arrowhead pointing toward the parent class. This indicates an “is-a” relationship where a child class inherits attributes and behaviors from a parent class.
-
Windowinherits fromFrame. -
ConsoleWindowandDialogBoxinherit fromWindow. -
Circle,Rectangle, andPolygoninherit from the abstract classShape(e.g., a Circle is a Shape).
Aggregation
Represented by a solid line with an hollow diamond at the container end. This signifies a loose “has-a” or whole-part relationship where the child can exist independently of the parent.
-
WindowaggregatesShape(multiplicity1to*). AWindowcan contain multiple (*) shapes, but if the window is closed, the shapes themselves can still conceptually exist in memory or another context.
Composition
Represented by a solid line with a filled (black) diamond at the container end. This indicates a strong “has-a” relationship with a coincident lifetime—if the container is destroyed, the parts are destroyed too.
-
Circleis composed ofPointobjects (multiplicity1to*). A circle cannot exist without its center or boundary points; destroying the circle destroys these specific point references.
Dependency
Represented by a dashed arrow. It shows that one class relies on another, meaning a change to the target class may affect the source class.
-
Windowhas a dependency onEvent(indicated by the dashed arrow pointing toEvent). The window relies on event triggers to execute operations likehandleEvent().
Association
Represented by a simple solid line. It indicates a structural relationship where objects of one class are connected to objects of another.
-
DialogBoxis associated withDataController, meaning they communicate with one another to pass information or coordinate behavior.
Documentation Elements
-
Note: The diagram features a note box with a folded corner connected via a dashed line to the
Windowclass. It provides human-readable context: “The main window of the application.”
-
Designing object-oriented software architecture
-
Documenting domain models
-
Generating code skeletons
2. Component Diagrams
Purpose: Show organization and dependencies of implementation units.
Key Elements:
-
Components (stereotyped as
«component») -
Provided/required interfaces (ball-and-socket notation)
-
Assembly connectors and dependency relationships
-
Artifacts (compiled outputs: JARs, DLLs, executables)
Example Use:When to Use:
Components and Modular Boundaries
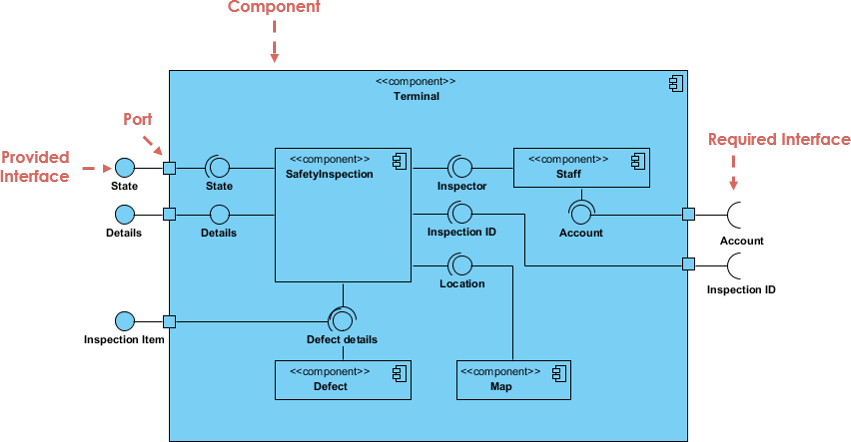
At the core of the diagram is the concept of a component, an autonomous and modular unit of a system that encapsulates its contents and manifests its behavior through clean interfaces. The large outer boundary represents the overarching Terminal component, which acts as a subsystem or container. Within this container reside smaller, specialized internal components—namely SafetyInspection, Staff, Defect, and Map. Each of these internal units represents a modular piece of software or data management logic working together to fulfill the Terminal’s responsibilities.
Interfaces as Contracts
Components do not expose their internal logic directly; instead, they interact via well-defined interfaces that serve as architectural contracts.
-
Provided Interfaces: Represented by a “lollipop” or circle symbol, these signify the services, data, or operations that a component implements and offers to its environment. For instance, the outer Terminal component exposes external provided interfaces like State, Details, and Inspection Item, indicating what external clients can request from it.
-
Required Interfaces: Represented by a “socket” or half-circle symbol, these specify the services or data that a component needs from another entity to function properly. On the right side of the diagram, the Terminal component explicitly exposes required interfaces for Account and Inspection ID, showing its dependencies on external subsystems.
Ports and Internal Wiring
To manage the flow of data and control while preserving encapsulation, the system uses ports and delegation relationships.
-
Ports: The small squares sitting on the boundary of the components represent ports. They act as distinct interaction points through which the component’s internal structure connects with the outside world. Ports allow a component to isolate its internal wiring from the external environment, meaning internal components can be replaced or modified without altering how the parent component appears to the outside.
-
Delegation and Assembly: Inside the Terminal, lines connect these interfaces to form the structural assembly. A provided interface on the outer port delegates incoming requests directly to an internal component’s provided interface (as seen with the State and Details paths leading into SafetyInspection). Conversely, internal components wire their required socket interfaces directly into the provided lollipop interfaces of neighboring components. For example, the SafetyInspection component relies on the Inspector interface provided by Staff, the Defect details interface provided by Defect, and the Location interface provided by Map, creating a tightly coordinated but loosely coupled internal ecosystem.
-
Planning modular system architecture
-
Managing build dependencies
-
Documenting reusable component libraries
3. Composite Structure Diagrams (Added in UML 2.0)
Key Elements:
-
Parts (properties with whole-part relationships)
-
Ports (interaction points with provided/required interfaces)
-
Connectors (runtime links between parts)
-
Collaboration occurrences
Example Use: Modeling a Car:
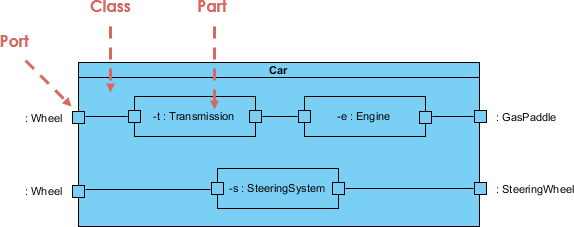
Encapsulating Classifier (Class)
The outer rectangle represents the containing classifier, in this case, the Car class. In a composite structure diagram, this boundary acts as a container that encapsulates the internal runtime configuration of the system. It defines the context within which individual instances cooperate to achieve a broader behavioral purpose, hiding the complexity of how a “Car” works internally from external entities.
Parts (Internal Structure)
The internal rectangles within the Car boundary represent Parts. A part explains a role played by a set of instances during the execution of the containing classifier. Rather than showing a static compile-time relationship (like a standard class diagram), these parts denote runtime instances filling specific architectural slots:
-
-t : Transmission: An instance playing the role of the transmission system. -
-e : Engine: An instance playing the role of the engine power source. -
-s : SteeringSystem: An instance playing the role of the steering mechanism.
The colon notation indicates that these are structural roles typed by their respective classes, defining exactly what components must exist inside an operational Car.
Ports and Boundaries
The small squares embedded on both the outer classifier boundary and the internal part boundaries represent Ports. Ports are distinct interaction points that decouple the internal structure of a classifier from its external environment.
-
External ports on the Car boundary—such as
: Wheel,: GasPaddle, and: SteeringWheel—expose how the Car interacts with the outside world or physical environment without exposing which internal parts are handling those interactions. -
Ports on the internal parts (like the ports on the Transmission or Engine blocks) govern how these sub-systems communicate with each other or with the parent boundary.
Connectors and Internal Wiring
The solid lines linking the ports together represent Connectors. Connectors define the communication pathways between parts or between a part and an external port at runtime.
-
Delegation Connectors: Connect an outer port of the container directly to an inner port of a part. For example, the external
: Wheelport routes directly into the Transmission, and the external: SteeringWheelroutes straight to the SteeringSystem. This ensures that external stimuli are seamlessly delegated to the correct internal actor. -
Assembly Connectors: Link internal parts together to allow collaboration. The connector between the Transmission and the Engine shows that these two distinct runtime roles directly exchange signals, data, or mechanical force to make the car function as a unified whole.
When to Use:
-
Documenting design patterns
-
Modeling complex internal collaborations
-
Bridging class design and component implementation
4. Deployment Diagrams
Purpose: Map software artifacts to hardware execution environments.
Key Elements:
-
Nodes (devices, execution environments)
-
Artifacts (deployable units)
-
Communication paths between nodes
-
Deployment specifications (configuration details)
Example Use:When to Use:
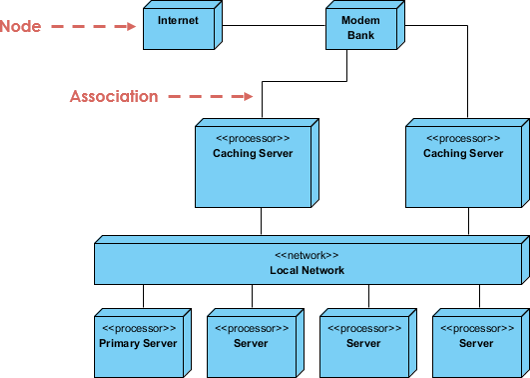
Nodes and Physical Infrastructure
Unlike logical design diagrams that model code layout or class structures, a deployment diagram focuses on the hardware topography. The primary building blocks are Nodes, which are represented visually as three-dimensional cubes. Nodes illustrate physical computational resources or execution environments where software software elements actually run:
-
<<processor>>Nodes: Cubes stereotyped with<<processor>>(such as Caching Server, Primary Server, and generic Server blocks) represent nodes with computational capacity, memory, and processing power capable of executing software binaries. -
<<network>>Nodes: The elongated cube labeled Local Network represents a communication path or routing infrastructure rather than an individual computer. It signifies the physical backbone that allows connected processors to exchange data packet streams. -
Device Nodes: Unstereotyped nodes like Internet and Modem Bank represent boundary hardware components or external physical infrastructure required to route external traffic into the core system environment.
Associations and Communication Pathways
The solid lines connecting the three-dimensional cubes represent Associations. In a deployment diagram, these associations map out the physical communication paths, network links, or hardware connections between nodes.
-
The line between Internet and Modem Bank illustrates the entry point of external public data into the hardware stack.
-
The association extending from the Modem Bank down into the Caching Server maps out the physical routing of incoming traffic down to the edge caching layer.
-
Associations linking the Caching Servers and the underlying Primary Server cluster to the Local Network establish how internal components communicate over a shared high-speed local bus or network switch infrastructure.
Topological Layering and Redundancy
The arrangement of nodes in the diagram explicitly shows the deployment topology and architectural design choices for high availability and load distribution.
-
Edge Caching Layer: Positioned directly below the entry-point modem hardware are two distinct, parallel Caching Server nodes. This configuration visually demonstrates a redundant edge layer designed to distribute the incoming traffic load and cache assets before requests reach deep infrastructure.
-
Internal Server Farm: Positioned at the bottom of the stack, connected via the Local Network, is a cluster of core servers. The differentiation between the Primary Server and the adjacent generic Server nodes visually maps out a master-replica or primary-secondary architecture layout, ensuring data persistence and heavy computing workloads are safely coordinated within the internal data center environment.
Purpose: Model internal structure of classifiers and complex patterns.
-
Planning system infrastructure
-
Documenting distributed architectures
-
Specifying failover and redundancy strategies
5. Package Diagrams
Purpose: Organize and manage namespaces through logical grouping.
Key Elements:
-
Packages (rectangles with tabs)
-
Import/access relationships (
«import»,«access») -
Merge relationships (
«merge») -
Visibility (
+public,-private)
Example Use:
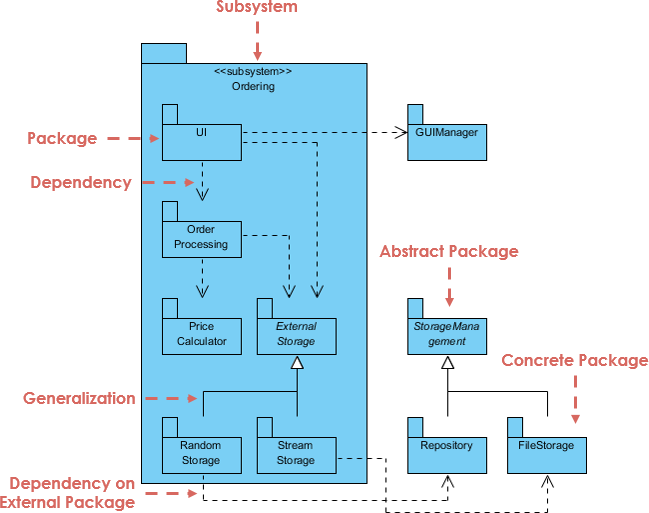
Subsystem and Package Boundaries
The diagram relies heavily on the “folder” notation to represent logical groupings of design elements.
-
Subsystem: The large outer folder stereotyped as
<<subsystem>> Orderingrepresents a major, encapsulated behavioral unit of the physical system. It acts as a high-level container that groups related components and packages required to execute order management. -
Package: The smaller folders inside and outside the subsystem (such as UI, Order Processing, and GUIManager) are standard packages. They are used to organize elements into manageable groups, establish namespaces, and define boundaries of visibility within the architecture.
Dependencies and Layering
Dasherized arrows indicate Dependencies, establishing that a change in one package (the target) may affect the functioning of the originating package (the source).
-
Internal Dependencies: Within the Ordering subsystem, a clear top-down architectural layering is visible. The UI package depends on Order Processing, which in turn depends on the Price Calculator and External Storage. This represents an architectural flow where higher-level presentation elements rely on core business logic and data access layers.
-
Dependency on External Package: Packages can also depend on elements outside their immediate subsystem boundary. For instance, the UI package has a dependency on the external GUIManager. Similarly, the Random Storage and Stream Storage packages at the bottom cross the subsystem boundary to depend on external data structures, highlighting how the subsystem integrates into a larger software ecosystem.
Abstraction and Inheritance (Generalization)
The diagram uses specialized styling and relationship arrows to demonstrate abstract design patterns applied to modular architecture.
-
Abstract vs. Concrete Packages: Packages containing abstract elements or defining an interface-like structure are represented with italicized names (such as External Storage and StorageManagement). Conversely, packages containing operational code implementations, like Repository and FileStorage, use standard text to denote they are concrete packages.
-
Generalization: Represented by a solid line with an open, hollow triangle pointing to the parent package. This indicates an inheritance or implementation relationship. Inside the subsystem, Random Storage and Stream Storage specialize or implement the abstract External Storage interface. Outside the subsystem, the concrete Repository and FileStorage packages generalize up into the abstract StorageManagement package, showing how polymorphic behavior and structural classification can be modeled at the package level.
-
When to Use:
-
Managing large codebases
-
Defining module boundaries
-
Controlling compilation dependencies
6. Object Diagrams
Purpose: Show snapshots of instances and their links at a specific moment.
Key Elements:
-
Objects (underlined names:
myCar:Car) -
Links between object instances
-
Attribute values at runtime
Example Use:
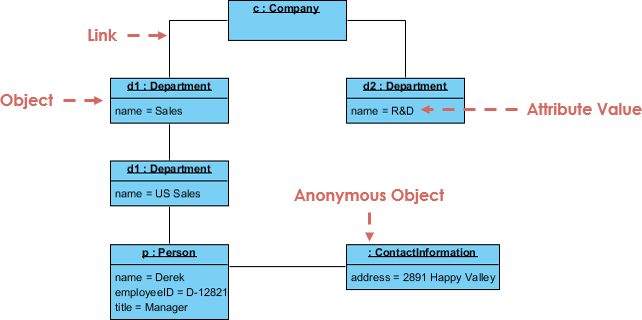
Objects and Concrete Instances
Unlike class diagrams which show abstract, blueprint-level configurations, an object diagram captures actual instances living in memory. Objects are represented by rectangles, and their names are always underlined to denote instantiation.
-
Named Objects: These follow the syntax
instanceName : ClassName. For example,c : Companyrepresents a specific company instance named “c”, andp : Personrepresents a specific individual instance named “p”. -
Anonymous Objects: When the specific instance identifier is omitted or irrelevant to the scenario, only the class name is provided, prefixed by a colon (e.g.,
: ContactInformation). This specifies that a concrete instance of contact information exists and is attached to the structure, but it does not need a unique variable name in this context.
State and Attribute Values
The lower compartment of an object rectangle contains its specific state, defined by explicit values assigned to its attributes at that given moment. Rather than just listing data types, these entries use the attribute = value assignment format to reflect reality:
-
The department instance
d1holds the attribute valuename = Sales. -
Another distinct department instance
d2holds the valuename = R&D. -
The person instance
pholds an entire set of state data, mapping out a specific profile:name = Derek,employeeID = D-12821, andtitle = Manager.
Links and Relationships
The solid lines connecting the objects represent Links. A link is a concrete instance of an association defined between classes. If a class diagram states that Companies have Departments, the object diagram demonstrates the actual runtime connections between them.
-
The company instance
cis actively linked to department instancesd1(Sales) andd2(R&D). -
The diagram also showcases hierarchical instance wiring, where
d1 : Department(Sales) links down into a sub-department instance also typed as a Department (name = US Sales). -
Finally, the person instance
p(Derek) is linked to the US Sales department instance, while simultaneously maintaining a link to an anonymous: ContactInformationinstance containing his physical address.
When to Use:
-
Validating class diagram designs
-
Debugging complex object relationships
-
Demonstrating example runtime states
🔶 Behavioral Diagrams
Behavioral diagrams model dynamic aspects—how the system behaves over time.
7. Activity Diagrams
Purpose: Model workflows, business processes, and algorithmic logic.
Key Elements:
-
Actions (rounded rectangles)
-
Control nodes: initial, decision, merge, fork, join, final
-
Object nodes and pins
-
Partitions (swimlanes) for responsibility assignment
-
Exception handlers and interruptible regions
Example Use: Order Processing Workflow
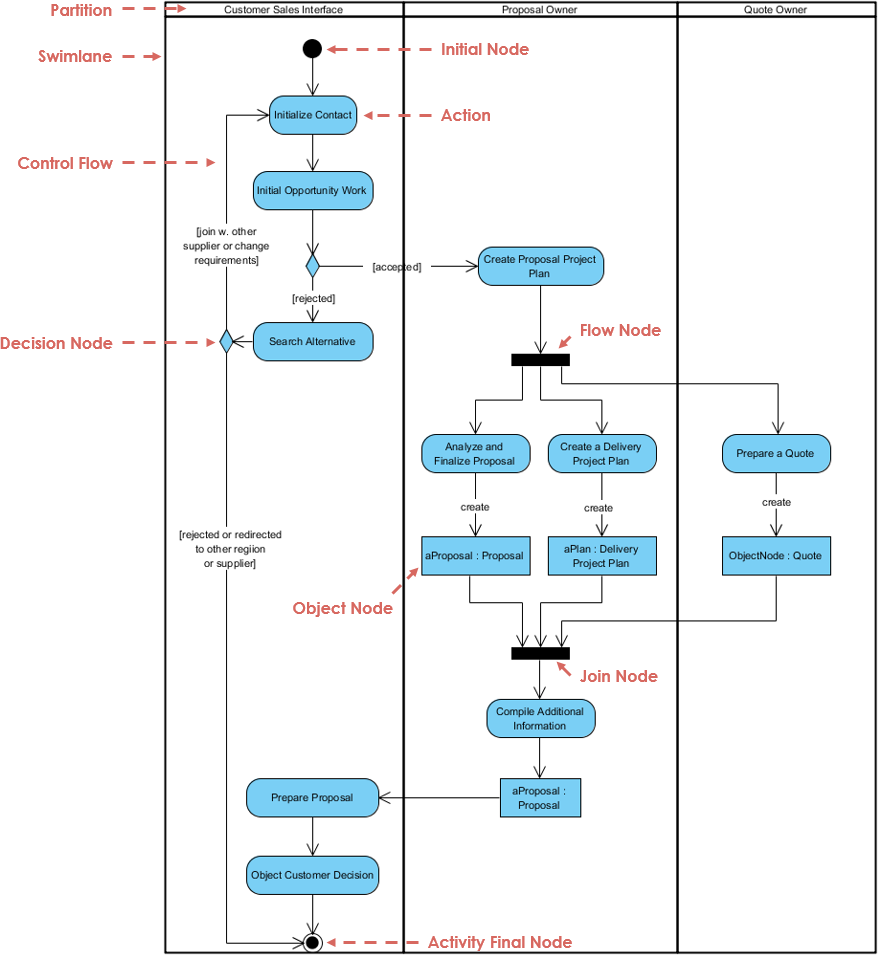
Structural Organization (Swimlanes and Partitions)
The diagram is organized vertically into large columns known interchangeably as Swimlanes or Partitions. These boundaries categorize responsibilities for the actions contained within them, mapping steps to specific roles or business units:
-
Customer Sales Interface: Owns the customer-facing lifecycle, handling client initialization, alternative routing, and ultimate presentation.
-
Proposal Owner: Manages the core planning, operational analysis, and compilation of the formal proposal data structures.
-
Quote Owner: Focuses purely on financial valuation and preparing the specific quote metrics.
Control Flow and Action States
The step-by-step procedural execution is directed by control nodes and directed pathways.
-
Initial Node: Represented by the solid black circle at the top, this indicates the starting point of the entire activity workflow.
-
Action: The rounded rectangles (e.g., Initialize Contact, Search Alternative, and Compile Additional Information) represent single, non-decomposable steps or tasks within the execution sequence.
-
Control Flow: The solid arrows connecting the elements dictate the sequential progression of the workflow, indicating exactly which action must complete before the next begins.
-
Activity Final Node: The bullseye symbol (a solid circle inside a hollow ring) at the bottom marks the absolute termination point of the entire process execution.
Routing and Guarded Logic (Decision Nodes)
Diamond-shaped symbols represent Decision Nodes, which model conditional branching in the workflow.
-
Incoming control paths are split into multiple mutually exclusive outgoing paths based on specific inputs.
-
The conditions that govern which path to take are enclosed in square brackets, known as guard conditions (such as
[accepted],[rejected], and[join w. other supplier or change requirements]). The process evaluates these guards at runtime to route execution down the appropriate functional path.
Parallel Processing (Fork and Join Nodes)
The solid black bars in the diagram act as synchronization points to manage concurrent or parallel execution streams.
-
Fork Node (labeled as Flow Node in the diagram pointer): A single incoming control flow enters the bar and splits into multiple independent, concurrent threads of execution. Here, after creating a project plan, the process forks to allow the Proposal Owner to execute analysis and delivery planning while the Quote Owner simultaneously handles the quote preparation.
-
Join Node: A synchronization bar that merges multiple concurrent paths back into a single control flow. The process cannot pass past the Join Node until all incoming parallel streams have successfully reached the bar, ensuring that quote compilation and proposal drafting are fully finalized before proceeding to compile the final package.
Data Integration (Object Nodes)
Standard rectangles signify Object Nodes, which introduce data flow into the control-oriented activity diagram.
-
Object nodes represent instances of specific data or physical artifacts produced or consumed by actions, using the
instanceName : ClassNameconvention (e.g.,aProposal : ProposalandaPlan : Delivery Project Plan). -
Explicitly marked
createarrows show exactly when an action instantiates or updates a data structure, demonstrating how data flows from task to task alongside the operational execution.
When to Use:
-
Documenting business processes
-
Modeling use case realizations
-
Specifying complex algorithms
8. State Machine Diagrams (Statecharts)
Purpose: Model the lifecycle and state-dependent behavior of objects.
Key Elements:
-
States (rounded rectangles with entry/exit/do activities)
-
Transitions (trigger[guard]/effect)
-
Pseudostates: initial, choice, fork, join, history, terminate
-
Composite states and orthogonal regions
Example Use: telephony setup
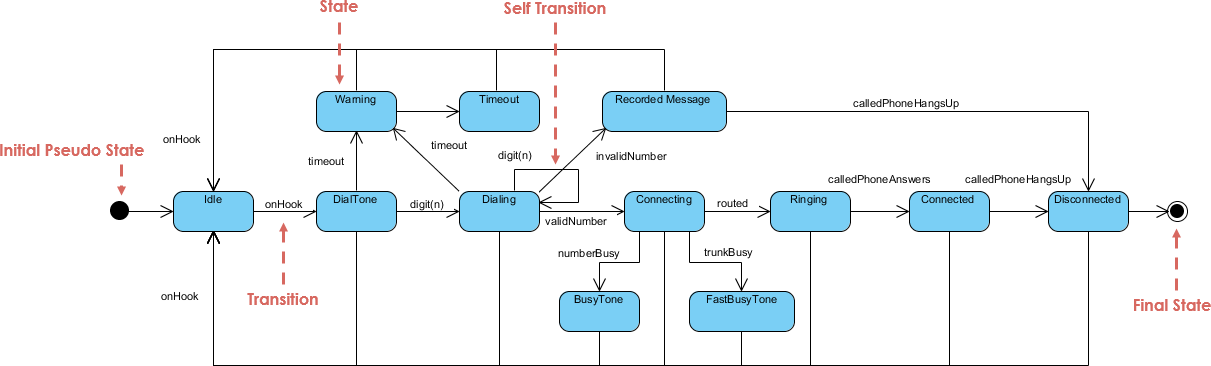
States and System Conditions
The diagram captures the behavior of a system—specifically a telephony setup—by mapping out its various discrete situations or conditions.
-
States: The rounded rectangles represent states (e.g., Idle, DialTone, Dialing, Connecting, and Connected). A state represents a period in the lifecycle of an object during which it satisfies some condition, executes an activity, or waits for an event.
-
Initial Pseudo State: The solid black circle on the far left represents the starting point of the state machine. It is a pseudo-state rather than a true state, serving merely as a pointer to the default active state when the object is instantiated (Idle).
-
Final State: The bullseye symbol on the far right represents the termination of the state machine’s execution, indicating that the object has completed its lifecycle.
Transitions and Event-Driven Routing
The directed lines connecting the states are Transitions, which represent the movement from one state to another as a response to a specific trigger.
-
Standard Transitions: Triggered by specific events, such as a user action or system response, noted along the lines. For example, moving from Idle to DialTone occurs when the
onHookevent is triggered, and moving from DialTone to Dialing happens when adigit(n)event is received. -
Self-Transitions: A transition arrow that loops out of a state and returns directly to that same state (as seen on the Dialing state with the
digit(n)trigger). This indicates that the event is processed and updates the internal state context (e.g., recording a newly dialed digit) without causing the object to exit or change its overarching operational state.
Alternative Paths and Error Handling
State machines excel at showing behavioral logic and error branching based on varying conditions during execution.
-
Successful Execution Path: The central horizontal pipeline maps out the optimal path: Idle $\rightarrow$ DialTone $\rightarrow$ Dialing $\rightarrow$ Connecting $\rightarrow$ Ringing $\rightarrow$ Connected $\rightarrow$ Disconnected.
-
Exception and Error Handling States: The system accounts for failures or delays by branching into dedicated handling states. If a number is busy during connection, the system triggers the
numberBusytransition to enter the BusyTone state. If a user pauses too long while dialing, atimeoutevent shifts the system into a Warning or Timeout state. If an incorrect sequence is detected, aninvalidNumbertrigger routes the system to a Recorded Message state, ensuring the system safely handles all real-world edge cases.
When to Use:
-
Modeling embedded systems or protocol implementations
-
Specifying UI state management
-
Documenting object lifecycle rules
9. Interaction Diagrams
Four diagram types emphasize different aspects of object collaboration:
a) Sequence Diagrams (Most Common)
Purpose: Show time-ordered message exchanges between lifelines.
Key Elements:
-
Lifelines (vertical dashed lines)
-
Messages (solid/dashed arrows with labels)
-
Execution occurrences (activation bars)
-
Combined fragments:
alt,opt,loop,par,break
Example Use:
Lifelines and Execution Contexts
The diagram reads from left to right to establish the participants, and from top to bottom to denote the passage of time.
-
Lifelines: The boxes at the top attached to dashed vertical lines represent lifelines. They model individual participants in the interaction, following the
instanceName : ClassNameconvention (e.g.,window : UI,aChain : HotelChain, andaHotel : Hotel). The dashed line tracks the existence of that participant throughout the sequence. -
Activation Bars: The thin, colored vertical rectangles resting on top of the lifelines indicate an Activation (or execution occurrence). These bars show exactly when an object is actively executing an operation or waiting for a nested sub-call to return.
-
Stopped: The large “X” symbol at the bottom of the
window : UIlifeline indicates destruction or termination, showing that this specific participant’s lifecycle has ended and its resources are released.
Message Types and Communication
Communication between participants is modeled via horizontal arrows representing messages, ordered sequentially using a hierarchical numbering system (e.g., 1, 1.1, 1.1.1).
-
Synchronous Messages: Solid lines with solid arrowheads (like
1: makeReservationand1.1: makeReservation) indicate synchronous calls. The sender blocks execution and waits for the receiving object to complete its processing. -
Self-Messages: A message loop that starts and ends on the same activation bar (such as
1.1.1: available(roomId, date): isRoomexecuted byaHotel) represents a Self-Message. This indicates an internal method execution where an object calls one of its own operations. -
Create Messages: A dashed line with an open arrowhead pointing directly to an object box (such as message
1.1.2:pointing toaReservation : Reservation) represents object creation. This shows that theaHotelinstance dynamically instantiates theaReservationobject at that exact moment in the runtime sequence.
Combined Fragments and Control Flow
Large rectangular boxes surrounding sections of the sequence are Combined Fragments, which use interaction operators to manage complex logic, branching, and iteration.
-
Loop Fragment: The outer box labeled
loopwith the guard condition[each day]represents iteration. All interactions contained within this box will repeat continuously for every day specified in the reservation request. -
Alternative Combined Fragment (Alt): Embedded inside the loop is an
altfragment (annotated as “If” in the diagram pointer), which handles conditional branching. It evaluates the guard condition[isRoom = true]. If the condition is met, the sequence executes the specific path inside that block—creating theaReservationinstance and subsequently triggering message2:to instantiateaNotice : Confirmation. If the condition were false, an alternative path (or no action) would be taken.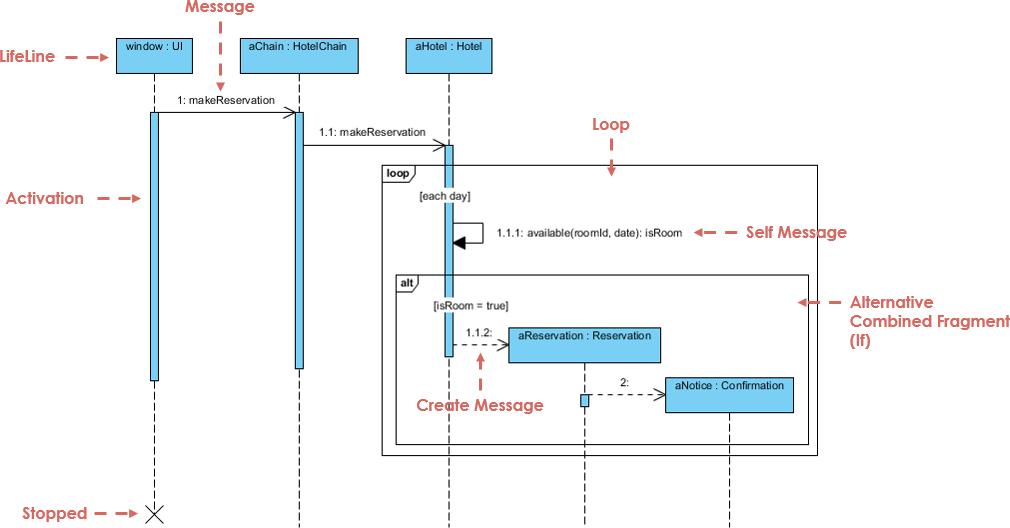
b) Communication Diagrams
Purpose: Emphasize object relationships over message timing.
Key Elements:
-
Objects as nodes
-
Links with numbered, directed messages
-
Focus on “who talks to whom”
c) Interaction Overview Diagrams
Purpose: High-level flow of control using activity-diagram notation.
Key Elements:
-
Interaction occurrences as activity nodes
-
Decision/merge for branching
-
Fork/join for parallelism
d) Timing Diagrams
Purpose: Model precise timing constraints (real-time systems).
Key Elements:
-
State timelines for each lifeline
-
Time scales and constraints
-
Message arrows with duration markers
When to Use Interactions:
-
Specifying use case realizations
-
Debugging complex message flows
-
Documenting API usage patterns
-
Modeling real-time protocol timing
10. Use Case Diagrams
Purpose: Capture functional requirements from an external actor’s perspective.
Key Elements:
-
Use cases (ovals or classifier rectangles)
-
Actors (stick figures or classifiers)
-
Associations (actor ↔ use case)
-
Relationships:
«include»,«extend», generalization -
System boundary box
Example Use: ATM System
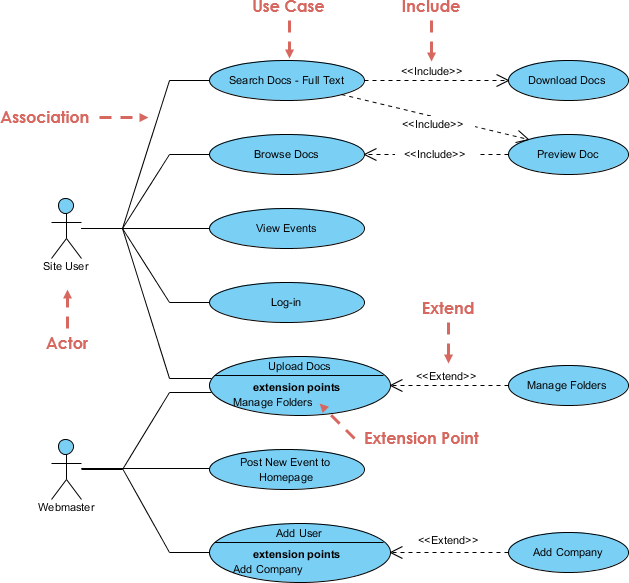
When to Use:
-
Requirements elicitation with stakeholders
-
Defining system scope and boundaries
-
Planning test scenarios
🎯 Choosing the Right Diagram: Decision Guide
| Goal | Recommended Diagram(s) |
|---|---|
| Design class structure | Class, Object, Package |
| Model runtime interactions | Sequence, Communication |
| Document business workflows | Activity, Use Case |
| Specify object lifecycle | State Machine |
| Plan system deployment | Deployment, Component |
| Model complex internal patterns | Composite Structure |
| Capture real-time constraints | Timing Diagram |
| Define requirements | Use Case, Activity |
🔑 Key Modeling Principles
-
Start simple: Begin with the diagram type that best matches your immediate goal.
-
Iterate: Refine models as understanding deepens—no diagram is “final” on first draft.
-
Audience matters: Tailor detail level to readers (developers vs. stakeholders).
-
Combine views: Use multiple diagrams to tell a complete story (e.g., Use Case → Sequence → Class).
-
Extend thoughtfully: Use stereotypes, tagged values, and profiles for domain-specific needs—but document conventions.
-
Keep it readable: Omit irrelevant details; use notes for supplemental context.
📌 Remember: “UML is a language, not a methodology.” It provides notation—not process. Choose diagrams that clarify communication, not ones that check boxes.
Conclusion
This post is also available in Español, فارسی, Français, English, Bahasa Indonesia and 日本語.