


Enterprise architecture serves as the blueprint for an organization, aligning business strategy with IT execution. Among the various frameworks available, ArchiMate stands out as a modeling language designed to describe, analyze, and visualize architecture. While powerful, the notation can appear dense to newcomers. This guide provides a structured approach to understanding these diagrams, focusing on layers, elements, and relationships without relying on specific software tools.
By mastering the visual language of ArchiMate, stakeholders can communicate complex structural changes clearly. This document breaks down the core components into manageable sections, ensuring you can interpret diagrams with confidence and accuracy.
🧱 Understanding the Foundation
Before diving into specific shapes and lines, it is essential to grasp the philosophy behind the framework. ArchiMate views an enterprise as a collection of interconnected layers. Each layer represents a specific aspect of the organization, from high-level strategy to underlying infrastructure.
Visualizing these layers allows architects to see how a change in one area impacts another. For instance, a new technology requirement might trigger a change in an application function, which in turn alters a business process. The diagram captures these dependencies.
Key principles for reading any diagram include:
- Context Awareness: Always check the scope of the diagram. Is it focused on a specific department or the entire organization?
- Layer Identification: Determine which layers are active in the view. Not all diagrams show every layer.
- Directionality: Observe the arrows. They indicate flow, dependency, or realization.
- Label Reading: Text labels define the specific identity of an element.
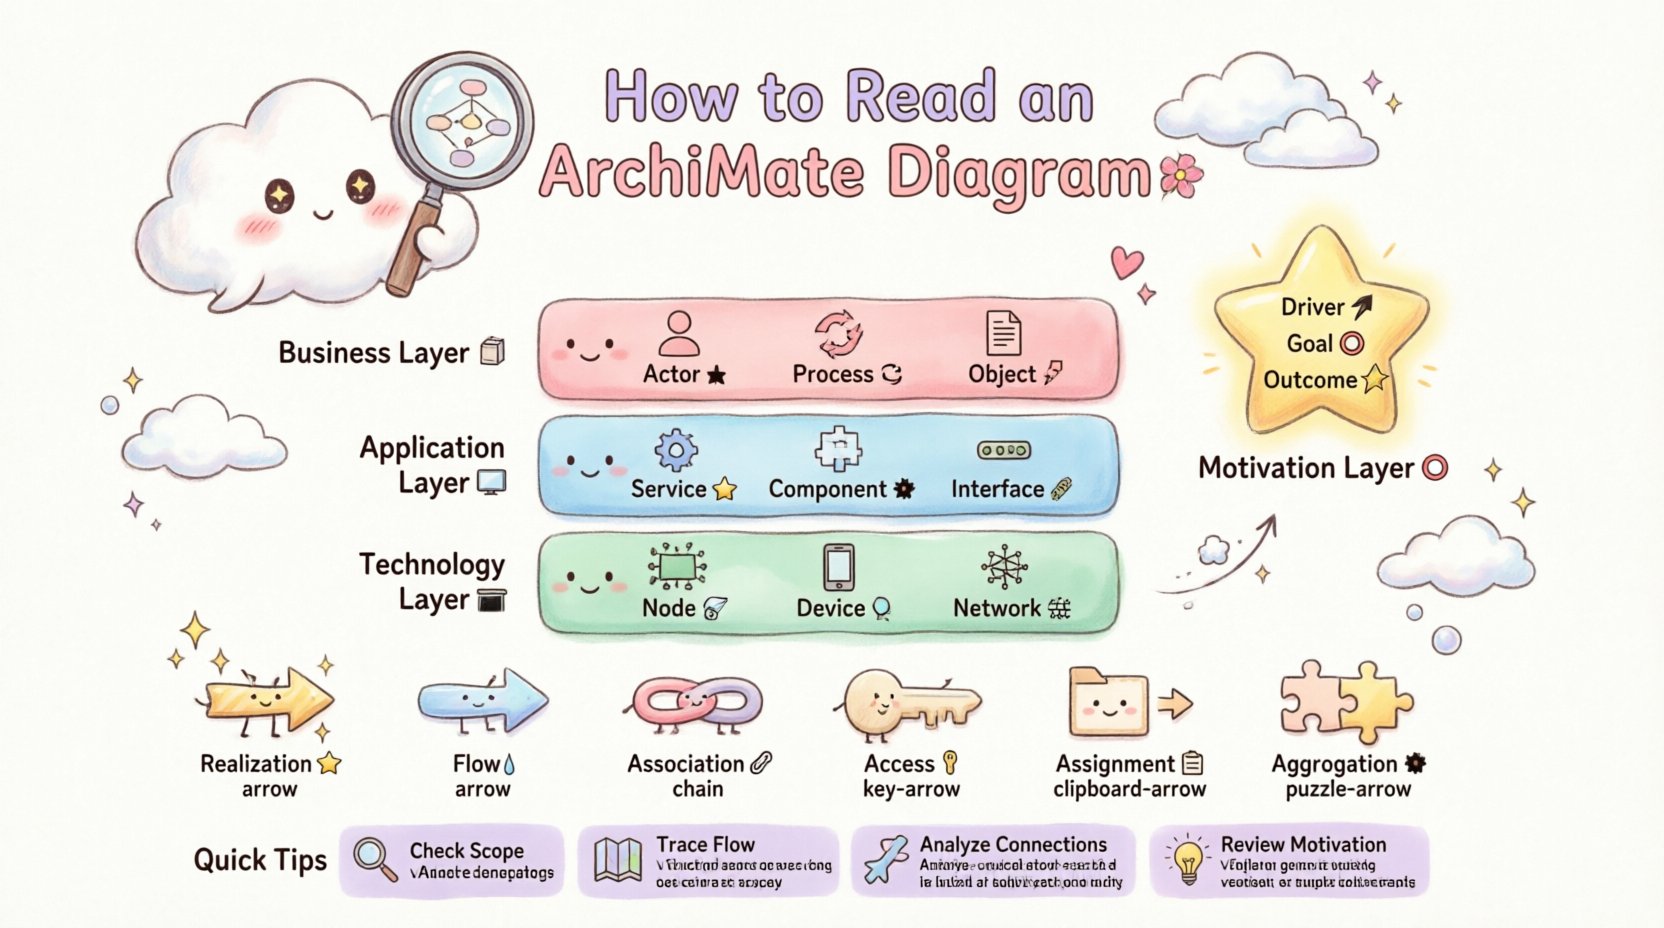
🏛️ The Three Core Layers
The backbone of ArchiMate consists of three primary layers. Understanding the distinct roles of each layer is the first step in decoding a diagram. These layers are stacked vertically, with the Business layer at the top and the Technology layer at the bottom.
1. Business Layer 🏢
This layer represents the visible operations of the organization. It describes how value is delivered to customers and how the organization is structured.
- Business Actor: Represents a human or organization that performs a role (e.g., Customer, Manager).
- Business Role: A collection of activities or responsibilities assigned to an actor (e.g., Sales Representative).
- Business Process: A structured set of activities (e.g., Order Fulfillment).
- Business Function: A coherent set of activities performed by the organization (e.g., Marketing).
- Business Object: Information being used or stored (e.g., Invoice, Contract).
2. Application Layer 💻
This layer bridges the gap between business needs and technical implementation. It describes the software services that support the business processes.
- Application Service: A set of functional capabilities provided by an application (e.g., Payment Processing).
- Application Component: A modular part of an application (e.g., Login Module).
- Application Interface: A point where an application interacts with another component or user.
3. Technology Layer 🖥️
This layer defines the physical or logical infrastructure required to run applications.
- Technology Node: A computational resource where software runs (e.g., Server, Cloud Instance).
- Device: Hardware used by a user (e.g., Laptop, Smartphone).
- System Software: Software that manages hardware resources (e.g., Operating System, Database).
- Network: Infrastructure for communication (e.g., LAN, Internet).
🎯 The Motivation Layer
While the three core layers describe the “what” and “how,” the Motivation layer describes the “why.” This layer connects architectural decisions to business goals and drivers.
- Driver: Something that influences the motivation of an enterprise (e.g., Regulatory Change).
- Goal: A specific objective the enterprise wants to achieve (e.g., Reduce Costs).
- Outcome: The result of achieving a goal (e.g., Increased Efficiency).
- Principle: A rule or guideline that directs action (e.g., Data Privacy).
- Assessment: An evaluation of a gap or an opportunity.
When reading a diagram, look for elements in this layer to understand the business case behind architectural changes.
🔗 Decoding Relationships
Elements in ArchiMate are rarely isolated. Relationships define how they interact. The direction of the arrow and the type of line indicate the nature of the connection. Misinterpreting relationships can lead to incorrect assumptions about system behavior.
Below is a comprehensive table of common relationships used in modeling.
| Relationship Type | Description | Example Scenario |
|---|---|---|
| Realization | One element realizes another (e.g., a component realizes a service). | A Login Component realizes the Authentication Service. |
| Flow | Indicates the flow of data or material between elements. | An Invoice flows from the Order System to the Billing System. |
| Association | A non-directional link between two elements. | A Business Actor is associated with a Business Process. |
| Access | One element accesses another. | A Business Process accesses a Business Object. |
| Assignment | A role or actor is assigned to an activity. | A Manager is assigned to the Approval Process. |
| Aggregation | A whole-part relationship without strong ownership. | A Department aggregates multiple Teams. |
| Composition | A strong whole-part relationship where the part cannot exist without the whole. | A Project is composed of specific Tasks. |
🧐 Practical Steps to Interpret a Diagram
Reading a complex diagram can be overwhelming. Follow this systematic approach to extract meaning effectively.
Step 1: Identify the Scope
Check the title and any notes on the diagram. Is this a high-level view or a detailed technical specification? Understanding the level of detail helps you ignore irrelevant elements.
Step 2: Trace the Flow
Start with a specific business driver or goal. Follow the arrows to see how that driver is realized through processes, supported by applications, and hosted on technology. This top-down approach clarifies dependencies.
Step 3: Analyze Cross-Layer Connections
ArchiMate is powerful because it links layers. Look for lines that cross the horizontal boundaries.
- Does a Business Process access a Business Object that is stored in the Application Layer?
- Does a Business Service realize an Application Service?
Cross-layer connections often indicate integration points or critical dependencies. If a technology node fails, trace the line upward to see which business process is affected.
Step 4: Review the Motivation
If the diagram includes the Motivation layer, read the goals and drivers first. This provides context for the structural elements. Why does this application exist? To support which goal? This prevents getting lost in technical details without understanding the business value.
🛑 Common Patterns and Anti-Patterns
Certain patterns appear frequently in well-structured models. Recognizing them speeds up comprehension. Conversely, spotting anti-patterns can help identify areas that need clarification.
Valid Patterns ✅
- Layered Abstraction: Higher layers depend on lower layers. This shows how business needs drive technical choices.
- Service Orientation: Business processes consume services. This highlights decoupling between business logic and implementation.
- Clear Boundaries: Elements are grouped logically. There is no clutter.
Common Pitfalls ⚠️
- Mixing Layers Indiscriminately: While cross-layer links exist, having too many direct links between unrelated layers can confuse the model.
- Missing Relationships: Elements that look connected but have no defined relationship line are ambiguous.
- Overly Complex Aggregation: Using composition or aggregation excessively can make the hierarchy difficult to follow.
📊 Detailed Element Reference Table
To aid quick reference, here is a consolidated table of element types across the main layers.
| Layer | Element Type | Key Characteristic |
|---|---|---|
| Business | Actor | Entity performing activity |
| Business | Process | Sequence of steps |
| Business | Object | Data entity |
| Application | Service | Functional capability |
| Application | Component | Software module |
| Technology | Node | Computational resource |
| Technology | Device | User hardware |
| Motivation | Driver | Influencing factor |
🔍 Advanced Considerations for Complex Models
As diagrams grow in size, additional techniques are required to maintain clarity. Specialization and grouping become important.
1. Grouping and Packages
When an architecture spans multiple domains, use grouping elements to organize related components. This reduces visual noise and allows readers to focus on specific areas without losing context.
2. Specialization
Elements can be specialized to represent more specific types. For example, a generic “Application Component” can be specialized into “Database Component” or “Web Interface.” This adds detail without cluttering the main view.
3. Views and Viewpoints
A single diagram cannot show everything. Different stakeholders require different views.
- Business Stakeholders: Focus on Business and Motivation layers.
- IT Architects: Focus on Application and Technology layers.
- Developers: Focus on specific Application Components and Interfaces.
Reading a diagram requires knowing who the intended audience is. If a diagram contains too much detail for a business audience, it may obscure the strategic message.
✨ Tips for Clarity and Consistency
To ensure diagrams remain readable over time, adhere to consistent naming and styling conventions.
- Consistent Naming: Use the same terms for the same concepts across all diagrams. Avoid synonyms for identical elements.
- Standardized Shapes: Ensure that the shape of an element matches its type. Do not use a circle for a process if the standard is a rounded rectangle.
- Logical Layout: Arrange elements so that flow moves naturally (e.g., left to right or top to bottom).
- Color Coding: Use color to indicate status or layer, but ensure it does not distract from the structure.
📝 Summary of Interpretation Skills
Successfully reading an ArchiMate diagram involves more than recognizing shapes. It requires understanding the relationships between business intent, functional capabilities, and technical infrastructure. By systematically analyzing the layers and tracing the connections, you can uncover the logic behind the enterprise structure.
Practice is essential. Start with simple diagrams and gradually move to complex ones. Focus on the narrative the diagram tells about how value is created and delivered. This approach ensures you derive actionable insights from the visual data.
Remember that the goal of modeling is communication. A diagram that is technically accurate but difficult to read fails its purpose. Prioritize clarity and context in your own interpretations and creations.
🚀 Moving Forward
As you continue your journey with enterprise architecture, keep these core principles in mind. The framework is flexible, allowing for adaptation to specific organizational needs. However, the fundamental rules of the layers and relationships remain constant. Adhering to these standards ensures that your models remain interoperable and understandable across different teams and projects.
With this knowledge, you are equipped to tackle complex architectural challenges. Use these visual guides to facilitate discussions, identify gaps, and plan strategic changes effectively.
This post is also available in Deutsch, Español, فارسی, Français, English, Bahasa Indonesia, 日本語, Polski, Portuguese, Ру́сский, Việt Nam, 简体中文 and 繁體中文.