


Unified Modeling Language (UML) is a standardized modeling language used in software engineering to visualize, specify, construct, and document the artifacts of a software system. Developed by the Object Management Group (OMG), UML provides a common framework for describing system behavior, structure, and interactions in a way that is both intuitive and universally understood.
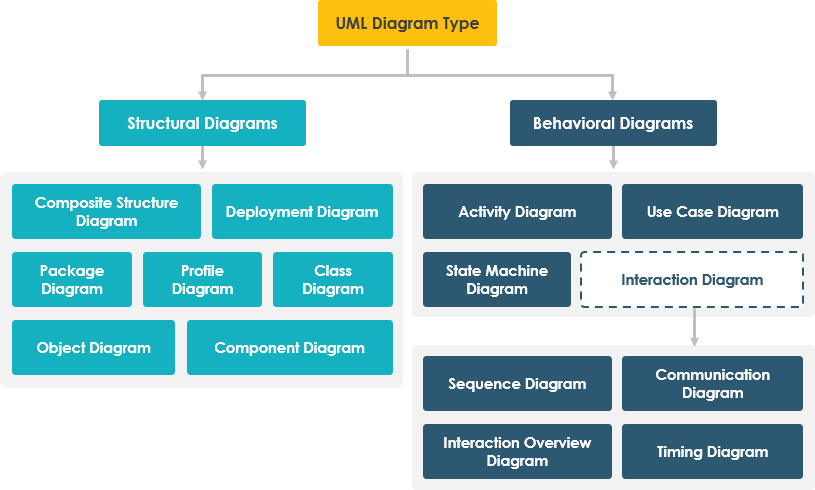
UML includes a set of diagrams categorized into two main groups: structural diagrams (focusing on the static components of a system) and behavioral diagrams (focusing on dynamic behavior and interactions). In this article, we’ll explore each type of UML diagram, its key concepts, and illustrate their usage through a real-world case study.
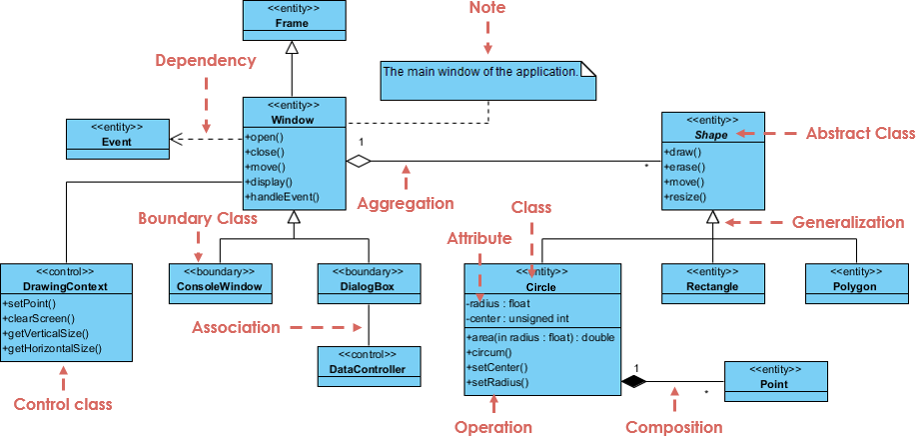
1. Class Diagram – The Blueprint of System Structure
Key Concepts:
-
Represents the static structure of a system.
-
Shows classes, their attributes, methods, and relationships (association, inheritance, aggregation, composition).
-
Uses boxes with three compartments: class name, attributes, and methods.
-
Supports concepts like encapsulation, inheritance, and polymorphism.
Use Case:
Class diagrams are ideal for designing object-oriented systems, defining the core entities and their relationships.
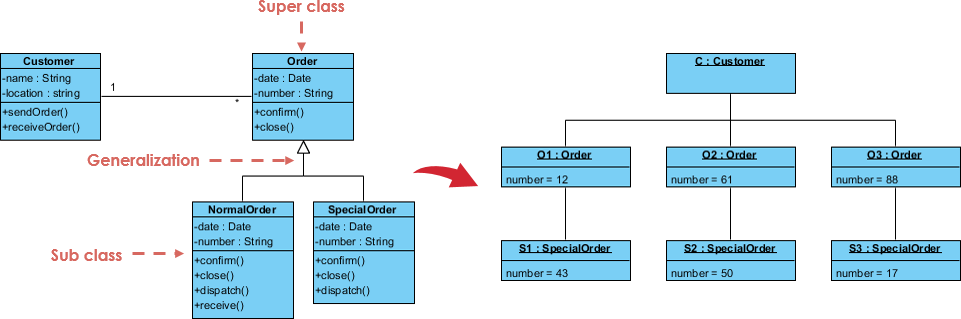
2. Object Diagram – A Snapshot of the System at a Point in Time
Key Concepts:
-
A snapshot of the class diagram at a specific moment.
-
Shows actual instances (objects) and their relationships.
-
Similar to a class diagram but with concrete values instead of abstract classes.
Use Case:
Useful for understanding how objects interact in a specific scenario, such as during a system state or before/after an operation.
3. Use Case Diagram – Capturing System Functionality from User
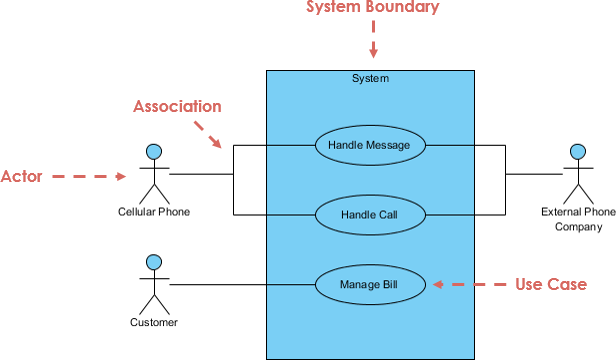
Perspective
Perspective
Key Concepts:
-
Illustrates user (actor) interactions with the system.
-
Shows functional requirements (use cases) and their relationships.
-
Includes actors (users or external systems) and use cases (functions or services).
-
Supports generalization (inheritance) between actors and use cases.
Use Case:
Used during requirements gathering to define what the system should do from a user’s viewpoint.
4. Sequence Diagram – Modeling Interactions Over Time
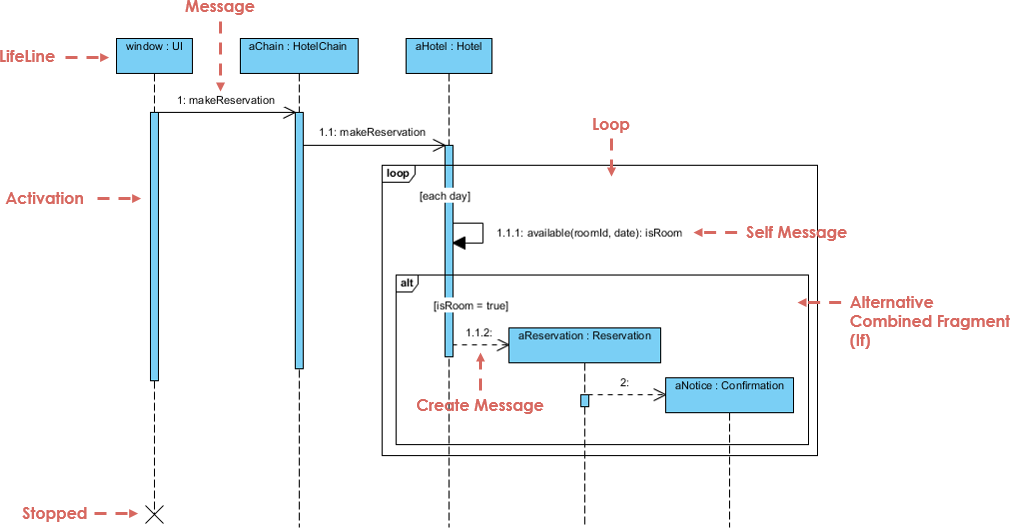
Key Concepts:
-
Shows how objects interact in a time-ordered sequence.
-
Vertical lifelines represent object lifetimes; horizontal arrows show messages.
-
Helps visualize the flow of control and timing of method calls.
Use Case:
Ideal for understanding complex interactions, such as user login, payment processing, or data validation workflows.
5. Collaboration (Communication) Diagram – Emphasizing Object
Relationships
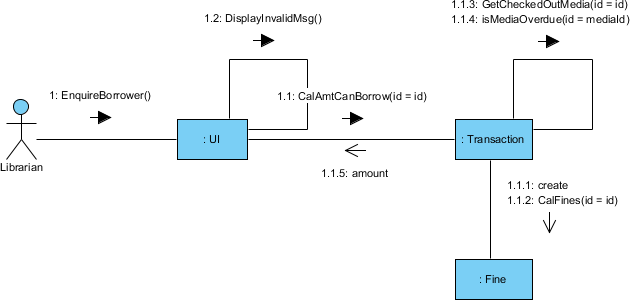
Key Concepts:
-
Focuses on the structural relationships between objects.
-
Similar to sequence diagrams but emphasizes object roles and links.
-
Messages are labeled on arrows connecting objects.
Use Case:
Better suited for illustrating object networks and dependencies, especially when the order of messages is less critical.
6. Activity Diagram – Modeling Workflows and Business Processes
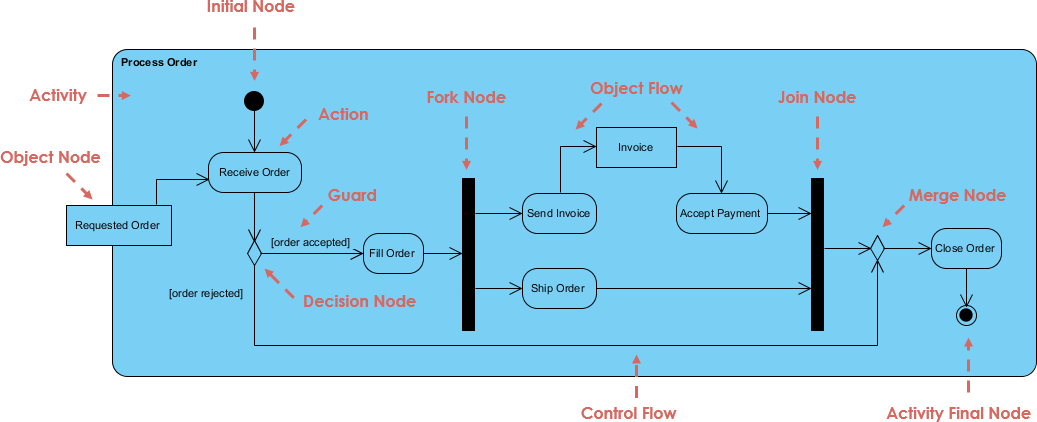
Key Concepts:
-
Represents workflows, decision points, and actions.
-
Uses symbols like start/end nodes, action nodes, decision diamonds, and forks/joins.
-
Similar to flowcharts but more expressive and scalable.
Use Case:
Excellent for modeling business processes, such as order processing, user onboarding, or system workflows.
7. State Machine (Statechart) Diagram – Depicting Object States and Transitions
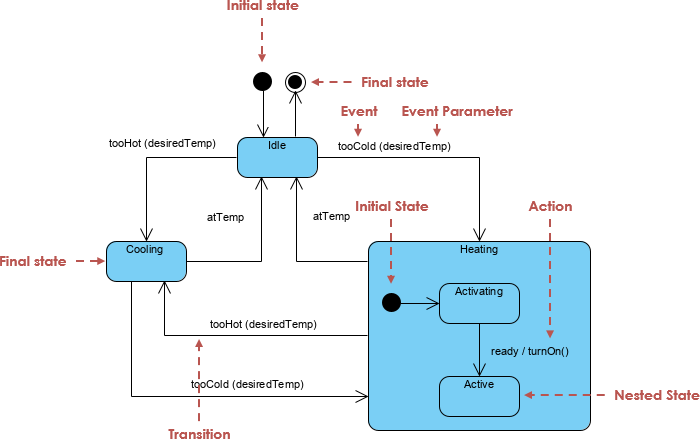
Key Concepts:
-
Shows the lifecycle of an object through various states.
-
Includes states, transitions, events, and actions.
-
Can model complex state behavior, such as in a vending machine or a user session.
Use Case:
Used to model systems with dynamic behavior, such as user authentication, order status, or device states.
8. Component Diagram – Representing System Components and Dependencies
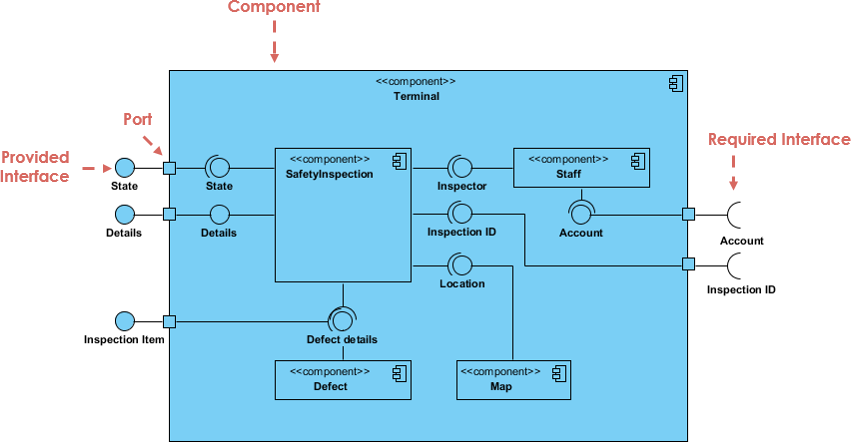
Key Concepts:
-
Shows how components (modules) are organized and how they depend on each other.
-
Components are represented as rectangles with a stereotype (e.g., «component»).
-
Arrows indicate dependencies (e.g., one component uses another).
Use Case:
Useful in modular design and system architecture, especially for large applications.
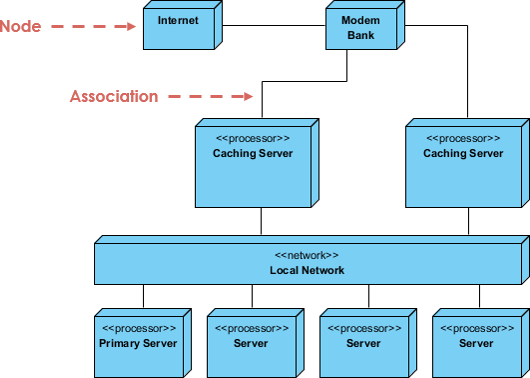
9. Deployment Diagram – Modeling Physical Architecture
Key Concepts:
-
Represents the physical deployment of hardware and software.
-
Nodes (hardware or software) are connected via communication paths.
-
Shows how software components are deployed on physical machines.
Use Case:
Critical in distributed systems, cloud deployments, and system infrastructure planning.
Case Study: Online Bookstore Management System
Let’s apply UML diagrams to a real-world scenario: Designing an Online Bookstore System.
Scenario:
An online bookstore allows users to browse books, add them to a cart, and check out. The system must manage inventory, user accounts, and order processing.
1. Use Case Diagram – Defining Functional Requirements
Key Elements:
-
Actors: Customer, Admin, Payment Gateway
-
Use Cases: Browse Books, Search Books, Add to Cart, Checkout, View Order History, Manage Inventory, Process Payment
Insight:
The use case diagram helps stakeholders (e.g., product owners) visualize what the system does. For example, the Checkout use case is triggered by the Customer and involves the Payment Gateway.
✅ Why it matters: Ensures all user needs are captured early in development.
2. Class Diagram – Defining the Core Entities
Key Classes:
-
User(id, name, email, password) -
Book(isbn, title, author, price, stock) -
Cart(items: List, total) -
Order(orderId, date, status, total, user) -
OrderItem(book, quantity, price)
Relationships:
-
Userhas oneCart -
Cartcontains manyBooks (aggregation) -
Ordercontains manyOrderItems (composition) -
Bookis part ofOrderItem
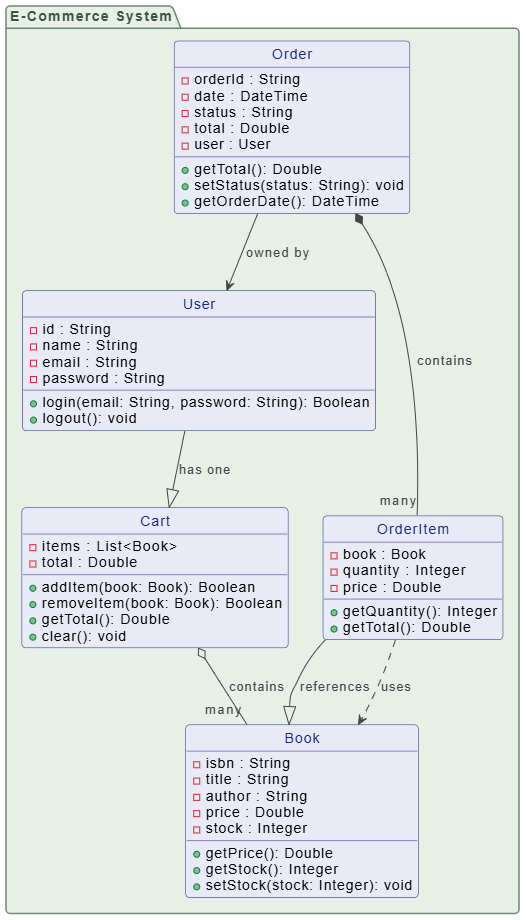
✅ Why it matters: Establishes the foundation for database schema and object-oriented design.
3. Sequence Diagram – Modeling the Checkout Process
Scenario: Customer checks out their cart.
Sequence:
-
Customer → Cart: Call
calculateTotal() -
Cart → Order: Create new Order
-
Cart → Payment Gateway: Call
processPayment(total) -
Payment Gateway → Cart: Return success/failure
-
Cart → Order: Update status to “Paid”
-
Order → Inventory: Call
deductStock() -
Inventory → Order: Confirm stock deduction
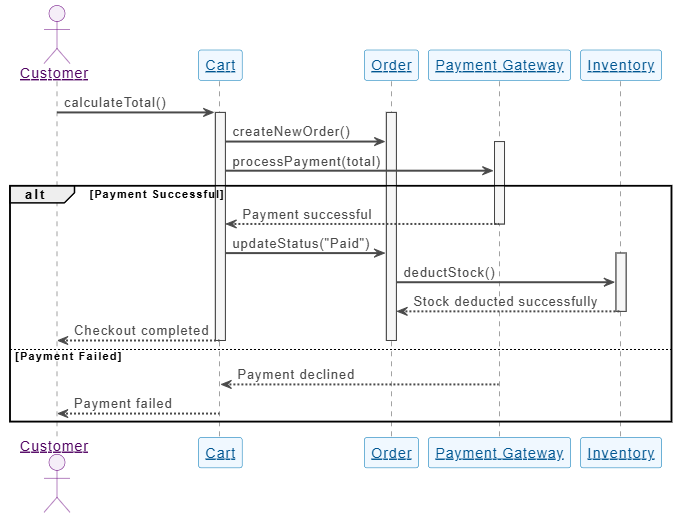
✅ Why it matters: Reveals potential bottlenecks (e.g., payment delay), and ensures all steps are accounted for.
4. Activity Diagram – Modeling the Order Processing Workflow
Flow:
-
Start → Customer adds book to cart → Proceed to checkout → Enter shipping info → Select payment method → Process payment → Success? → Update inventory → Send confirmation → End
Decision Points:
-
Is payment successful?
-
Is stock available?
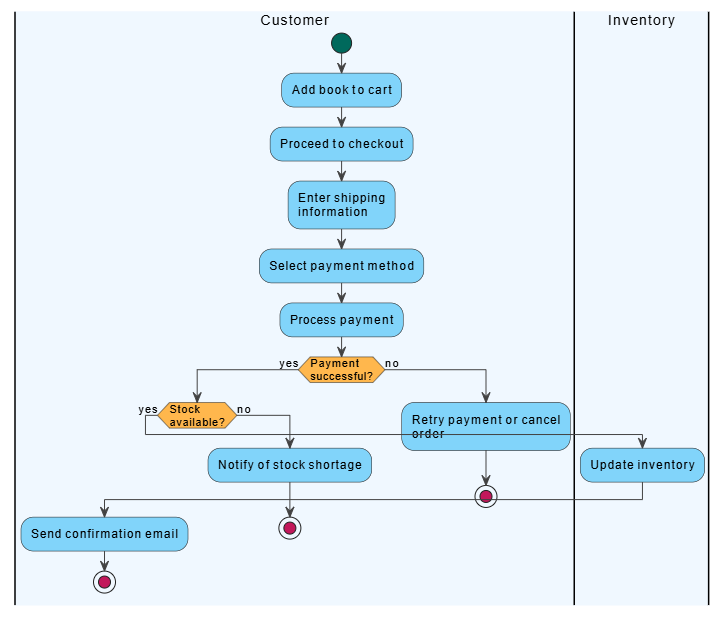
✅ Why it matters: Visualizes the entire process, helping developers and business analysts identify inefficiencies.
5. Statechart Diagram – Tracking Order Status
States:
-
Pending → Processing → Shipped → Delivered → Cancelled
Transitions:
-
“Payment successful” → Processing
-
“Shipment confirmed” → Shipped
-
“Customer reports issue” → Cancelled
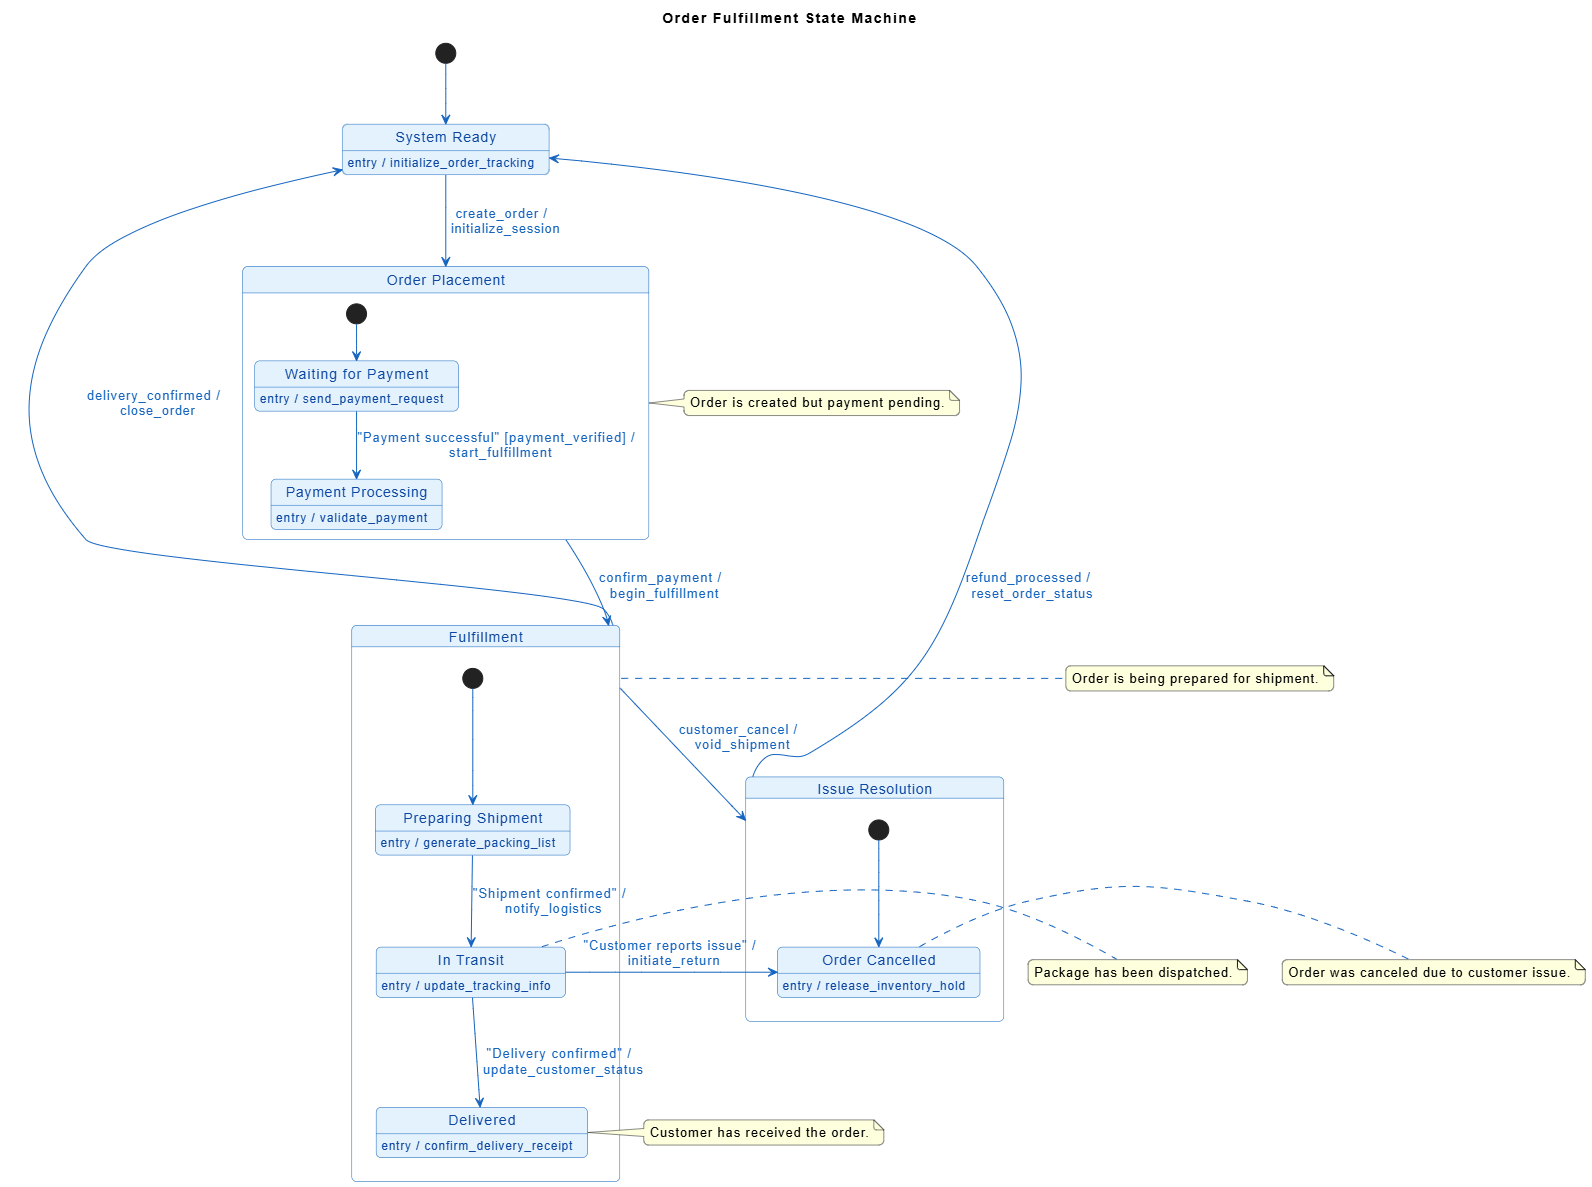
✅ Why it matters: Helps manage complex lifecycle states and triggers appropriate actions (e.g., refund, notification).
6. Component Diagram – Organizing the System Modules
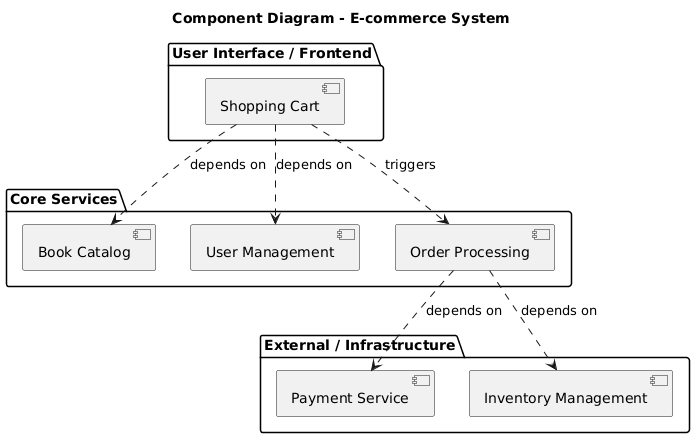
Components:
-
User Management -
Book Catalog -
Shopping Cart -
Order Processing -
Payment Service -
Inventory Management
Dependencies:
-
Shopping Cartdepends onBook CatalogandUser Management -
Order Processingdepends onPayment ServiceandInventory Management
✅ Why it matters: Guides modular development and team collaboration.
7. Deployment Diagram – Visualizing the Infrastructure
Nodes:
-
Web Server(hosts frontend and backend) -
Database Server(stores user, book, order data) -
Payment Gateway(external service)
Connections:
-
Web Server ↔ Database Server (via JDBC/ORM)
-
Web Server ↔ Payment Gateway (via HTTPS API)
✅ Why it matters: Ensures scalability and security planning—e.g., where to deploy microservices or cache data.
Conclusion: Why UML Matters
UML diagrams are not just visual tools—they are powerful communication and design aids. By using the appropriate UML diagram at the right stage of development, teams can:
-
Reduce misunderstandings between developers, stakeholders, and testers.
-
Catch design flaws early.
-
Improve code quality and maintainability.
-
Streamline documentation and onboarding.
In our Online Bookstore case study, we saw how each UML diagram plays a unique role—from capturing user needs (Use Case) to modeling real-time interactions (Sequence), managing workflows (Activity), and planning deployment (Deployment).
📌 Final Tip: Start with Use Case and Class Diagrams for requirements and structure. Then, use Sequence and Activity Diagrams for detailed logic. Save Statechart and Deployment diagrams for complex or production-level design.
Mastering UML is not just about drawing boxes and arrows—it’s about thinking clearly, designing wisely, and building better software, one diagram at a time.
Further Reading:
-
UML Distilled by Martin Fowler
-
Applying UML and Patterns by Craig Larman
-
Online tools: Visual Paradigm, Draw.io
Happy modeling! 🧩📘
UML Articles
- What is UML? A Comprehensive Guide to Unified Modeling Language: This in-depth introduction explains the purpose and key diagram types of UML and how it supports software design.
- Overview of the 14 UML Diagram Types – Visual Paradigm: This resource details the large volume of diagramming notation grouped into 14 different types serving different purposes.
- Practical Guide to UML: From Theory to Real-World Application: A hands-on tutorial showing how to apply various UML diagrams, including use case, class, and activity diagrams, in actual software projects.
- AI-Powered UML Class Diagram Generator by Visual Paradigm: This tool allows users to create professional class diagrams using AI-powered suggestions, validation, and PlantUML export.
- Visual Paradigm – AI-Powered UML Sequence Diagrams: This article explains how to generate professional sequence diagrams instantly from simple natural language text prompts.
- Adopting UML in Agile Projects: A Complete Tutorial with Visual Paradigm: A step-by-step guide on integrating UML into Agile development workflows to improve team planning and communication.
- What Is a Use Case Diagram? – A Complete Guide to UML Modeling: An explanation of use case diagrams, focusing on requirements analysis and best practices for system design.
- The Future of Modeling: How AI is Transforming UML Diagram Generation: This analysis highlights how AI is streamlining the creation of diagrams, moving modeling from manual sketching to automated generation.
- What is a Package Diagram in UML? – Visual Paradigm Guide: This guide explains how to organize and manage complex systems through the logical grouping of elements using package diagrams.
- What is a Deployment Diagram? A Complete Guide to UML Deployment Diagrams: This comprehensive guide explains how to model the physical architecture and hardware/software mapping of systems.
This post is also available in Deutsch, Español, فارسی, Français, English, Bahasa Indonesia, 日本語, Polski, Portuguese, Ру́сский, Việt Nam, 简体中文 and 繁體中文.