Learning Entity Relationship Diagrams: A Comprehensive Guide

Introduction to ER Diagrams

What is Entity Relationship Diagram (ERD)?

Entity Relationship (ER) diagrams provide a powerful way to visually represent the data requirements of a system and the relationships between different entities. They are particularly useful in database design, where understanding the relationships between various entities is critical to creating an efficient and effective database structure. ER diagrams help to identify the different entities, their attributes, and the relationships that exist between them, providing a comprehensive overview of the data model.

ER diagrams are a valuable tool for developers, designers, and stakeholders alike. Developers and designers can use ER diagrams to understand the data model requirements and create an optimized database schema that is both efficient and easy to maintain. Stakeholders, on the other hand, can use ER diagrams to visualize the data requirements of a system and provide feedback on how to improve its design.

Overall, ER diagrams are an essential part of database design and are widely used in a variety of industries and applications. By using ER diagrams, developers, designers, and stakeholders can ensure that the data model is designed to meet the requirements of the system, resulting in a database that is both efficient and effective.

Components of an ER Diagram

An ER diagram is composed of three main components: entities, attributes, and relationships. These components are used to create a visual representation of the data model and the relationships between the different entities.

  • Entities: Real-world objects represented in the data model, such as a customer or an order, that have a unique identity.

Entity Attributes

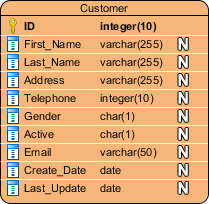
  • Attributes: Characteristics of an entity, such as name, address, or ID, that provide additional information about the entity and differentiate it from other entities.
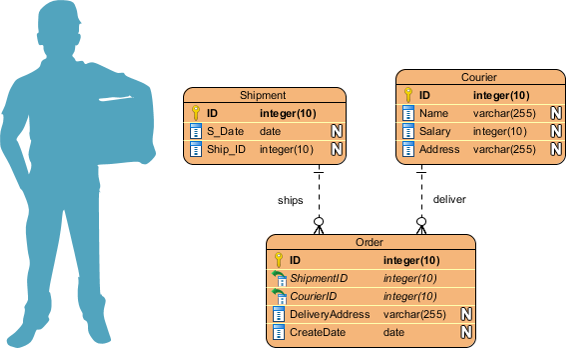
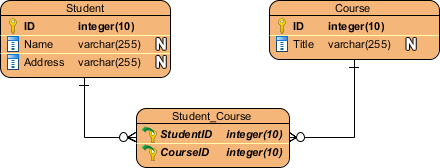
  • Relationships: Connections between two or more entities that describe how they are related to each other.
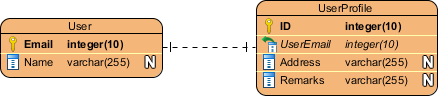
  • One-to-one relationship: Relationship where one entity is associated with another entity in a one-to-one relationship, meaning that each entity is associated with only one other entity.

One-to-One cardinality example One-to-Many cardinality example

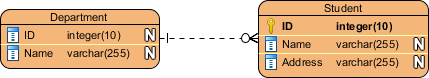
  • One-to-many relationship: Relationship where one entity is associated with many entities, while each associated entity is associated with only one entity.
  • Many-to-many relationship: Relationship where multiple entities are associated with multiple entities, and each entity can be associated with many other entities.

Many-to-Many cardinality example

  • Cardinality: Number of entities that can be associated with another entity in a relationship.
  • Modality: Level of participation required of an entity in a relationship, which can be optional or mandatory.
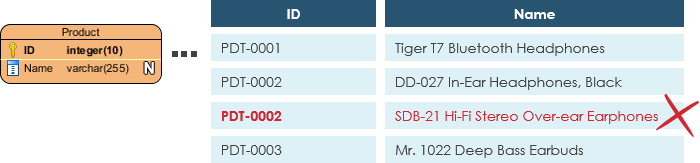
  • Primary Key: A primary key (PK) is a crucial aspect of entity-relationship diagrams (ERDs) in database design. It is an attribute that uniquely identifies each record in a database table. A primary key guarantees that there are no duplicate records in a table. In other words, it ensures that each record in the table is unique and can be identified without ambiguity.

The ERD example below shows an entity ‘Product’ with a primary key attribute ‘ID’, and a preview of table records in the database. The third record is invalid because the value of ID ‘PDT-0002’ is already used by another record.

Primary Key

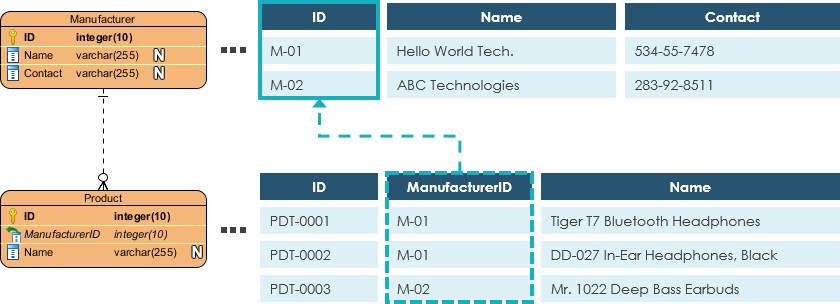
Foreign Key: A foreign key, commonly abbreviated as FK, is a crucial element in establishing relationships between entities in a database. It refers to a primary key in another table and is used to create a connection between the two tables. Unlike a primary key, a foreign key can contain duplicate values. This is because multiple records in one table can reference the same record in another table. The use of foreign keys in database design ensures data integrity and consistency by enforcing referential integrity between related tables.

The ER Diagram example below shows an entity with some columns, among which a foreign key is used in referencing another entity.
Foreign Key
The components of an ER diagram are entities, attributes, and relationships. Entities are real-world objects that have a unique identity, attributes provide additional information about an entity, and relationships describe the connections between entities. Cardinality and modality describe the specific characteristics of a relationship, providing a complete picture of the data model.

Types of ER Diagrams

ER diagrams are an important tool in database design, and there are three main types of ER diagrams: conceptual, logical, and physical. Each type of diagram is used at a different stage in the database design process and provides a different level of detail.

  1. The first type of ER diagram is the conceptual DFD, which provides a high-level view of the data requirements and relationships between entities. It is used to identify the main entities and their relationships and to provide a clear and simple overview of the database model. Conceptual ER diagrams are often used as a communication tool between stakeholders and developers and are used to ensure that everyone involved in the project has a shared understanding of the data model.

Conceptual data model

2. The second type of ER diagram is the logical DFD, which represents the data model in more detail, including relationships, attributes, and constraints. Logical ER diagrams provide a more detailed view of the data model and are used to refine the conceptual model. They are used to identify the specific attributes and relationships between entities and to define the business rules and constraints that govern the data model. Logical ER diagrams are often used to design the database schema and to ensure that the data model meets the requirements of the system.

Logical data model

3. The third type of ER diagram is the physical DFD, which is used to design the database schema and provides a detailed representation of the physical data model. Physical ER diagrams are used to map the logical data model to the physical database schema and include details such as data types, indexing, and storage structures. They are used to ensure that the database schema is efficient, scalable, and optimized for performance.

Physical data model

In short, there are three types of ER diagrams: conceptual, logical, and physical. Conceptual ER diagrams provide a high-level view of the data requirements and relationships between entities, while logical ER diagrams represent the data model in more detail and define the business rules and constraints. Physical ER diagrams are used to design the database schema and provide a detailed representation of the physical data model. Each type of diagram is used at a different stage in the database design process and provides a different level of detail.

Creating an ER Diagram

Creating an ER diagram is a critical step in designing a database. To create an ER diagram, you need to identify the entities and their attributes, define relationships between entities and assign the cardinality and modality, and finally create the ER diagram using a diagramming tool or software. Following the steps will help you to design a clear and concise database that accurately represents the data requirements and relationships between entities.

Here are the steps involved in creating an ER diagram:

  1. Identify the Entities and their Attributes: The first step in creating an ER diagram is to identify the entities that are going to be represented in the database. Each entity should have a unique identity and be associated with attributes that describe its characteristics. For example, if you are designing a database for a library, the entities might be books, borrowers, and authors. The attributes for the book entity might include the title, author, publisher, and ISBN.
  2. Define Relationships between Entities: The second step in creating an ER diagram is to define the relationships between entities. Relationships are the connections between two or more entities, and they can be one-to-one, one-to-many, or many-to-many. You need to assign the cardinality and modality for each relationship, which will help to define the specific characteristics of the relationship.
  3. Assign Cardinality and Modality: Cardinality and modality are essential characteristics of the relationship between entities. Cardinality describes the number of entities that can be associated with another entity in a relationship. For example, a book can be associated with one or many authors, but an author can be associated with many books. Modality describes the level of participation required of an entity in a relationship, which can be optional or mandatory.
  4. Create the ER Diagram: Once you have identified the entities, defined their attributes, and assigned relationships with cardinality and modality, it’s time to create the ER diagram. There are several tools available for creating ER diagrams, such as Visual Paradigm Online, Visio, and Visual Paradigm Desktop Edition. These tools allow you to create, edit, and modify ER diagrams with ease, and they provide a wide range of customization options to suit your needs.

Examples of ER Diagrams

How to Generate Data Specification from ERD? - YouTube

ER diagrams can be used to represent a wide range of entities and relationships in different systems. Examples of ER diagrams can be helpful in understanding the different types of relationships between entities. The examples below illustrate how ER diagrams can be used to design and understand the relationships between entities in various contexts, from e-commerce websites to hospital management systems.

Here are a few examples of ER diagrams:

  1. E-commerce website: An ER diagram for an e-commerce website might include entities such as customers, orders, and products. The relationships between these entities could include a customer placing an order, and an order containing multiple products. The ER diagram would include attributes for each entity, such as customer name, order ID, and product price.  ER Diagram Example: Simple Order System | Entity Relationship Diagram Template
  2. Hospital management system: An ER diagram for a hospital management system might include entities such as patients, doctors, and appointments. The relationships between these entities could include a patient being assigned to a doctor, and a doctor having multiple appointments. The ER diagram would include attributes for each entity, such as patient name, doctor name, and appointment date.
  3. Social media platform: An ER diagram for a social media platform might include entities such as users, posts, and comments. The relationships between these entities could include a user creating a post, and other users commenting on the post. The ER diagram would include attributes for each entity, such as user name, post ID, and comment text.
  4. Online banking system: An ER diagram for an online banking system might include entities such as customers, accounts, and transactions. The relationships between these entities could include a customer having multiple accounts, and an account having multiple transactions. The ER diagram would include attributes for each entity, such as customer name, account number, and transaction amount.

Benefits of Using ER Diagrams for Database Design and Maintenance

ER diagrams can be a valuable tool for visualizing and comprehending the connections between entities in a database. The following are some benefits of utilizing ER diagrams:

  1. Visual representation: ER diagrams provide a visual representation of the data requirements and relationships between entities, which can make it easier for stakeholders to understand and communicate their needs.
  2. Simplified database design: ER diagrams can help simplify the process of designing a database, by breaking down complex systems into smaller, more manageable parts.
  3. Improved data integrity: ER diagrams can help improve data integrity by ensuring that each entity has a unique identifier and that relationships between entities are clearly defined.
  4. Efficient database maintenance: ER diagrams can help to identify potential problems in the database, making maintenance and updates more efficient.

Conclusion

ER diagrams can be a powerful tool for visualizing and comprehending the relationships between entities in a database. They provide a clear and concise way of representing data requirements, simplifying database design, and improving data integrity. Additionally, ER diagrams can help identify potential problems in the database, making maintenance and updates more efficient. While there are some disadvantages to using ER diagrams, their benefits often outweigh any drawbacks. Ultimately, ER diagrams can help developers, designers, and stakeholders work together more effectively to create efficient and effective databases.


Leave a Reply

Your email address will not be published.