


In the intricate world of software development, communication is paramount. From the initial conceptualization of an idea to its final implementation, a shared understanding among stakeholders is crucial for success. This is where the Unified Modeling Language (UML) steps in, acting as a standardized blueprint for software, a visual language that bridges the gap between abstract ideas and concrete code.

The Genesis of a Standard
Before UML, software development was often a cacophony of disparate notations and methodologies. Each team, and sometimes even individual developers, would employ their own unique ways of representing system designs. This fragmentation led to significant challenges in collaboration, understanding, and maintainability. It was clear that a universal language was needed.
The late 1990s saw the convergence of several prominent object-oriented modeling methods, spearheaded by “The Three Amigos”: Grady Booch, Ivar Jacobson, and James Rumbaugh. Their combined efforts, under the auspices of Rational Software, led to the creation of UML 1.0 in 1997. This foundational version was quickly adopted by the Object Management Group (OMG) as an industry standard, marking a pivotal moment in software engineering history.
What is UML and Why Does it Matter?
At its core, UML is a graphical notation system designed to visualize, specify, construct, and document the artifacts of a software-intensive system. It’s not a programming language itself, but rather a tool for understanding and communicating how software systems are built and how they function. Think of it as the architectural drawings for a building – they don’t build the house, but they dictate its structure, components, and how they interact.
UML offers a rich set of diagram types, each tailored to represent different aspects of a software system. These diagrams provide multiple perspectives, allowing developers, architects, business analysts, and even non-technical stakeholders to grasp complex system behaviors and structures with clarity.
Why does UML remain indispensable for modern architectural clarity?
-
Standardized Communication: UML provides a universally understood visual vocabulary. This drastically reduces ambiguity and misinterpretations, fostering better collaboration within development teams and across different departments.
-
System Visualization: Complex software systems can be incredibly abstract. UML makes these abstractions tangible, allowing stakeholders to see and understand the architecture, data flows, and interactions at various levels of detail.
-
Early Problem Detection: By modeling a system before coding begins, potential flaws, inconsistencies, and design issues can be identified and rectified early in the development lifecycle, saving significant time and resources down the line.
-
Improved Documentation: UML diagrams serve as living documentation, providing clear and concise representations of the system’s design. This is invaluable for onboarding new team members, future maintenance, and system evolution.
-
Better Design Decisions: The act of modeling forces architects and developers to think critically about the system’s structure, behavior, and relationships, leading to more robust, scalable, and maintainable designs.
-
Facilitates Code Generation (in some cases): While not its primary purpose, some advanced UML tools can generate code stubs or frameworks from well-defined models, further streamlining the development process.
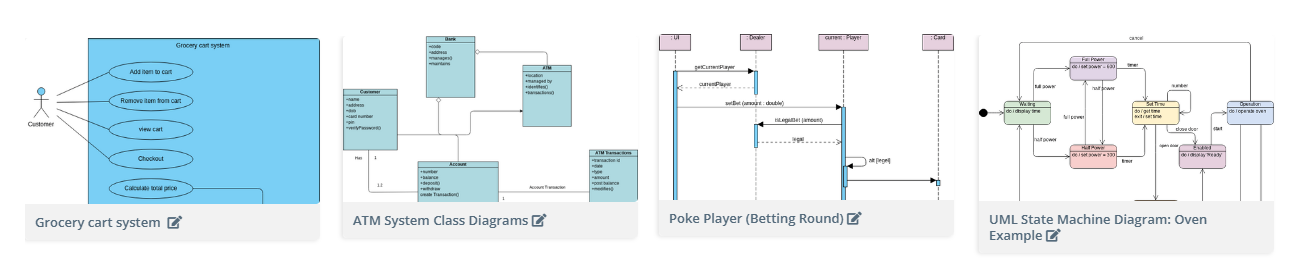
Key UML Diagram Types
UML encompasses a wide array of diagram types, broadly categorized into structural and behavioral diagrams.
Structural Diagrams: What the System Is
These diagrams focus on the static aspects of a system, illustrating its components and their relationships.
-
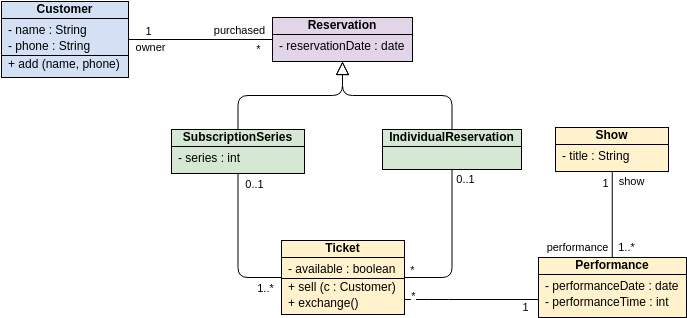
Class Diagram: The most fundamental UML diagram, it depicts the classes, interfaces, attributes, operations, and their relationships (association, inheritance, aggregation, composition). It’s crucial for understanding the static structure of a system.
-
Object Diagram: A snapshot of the system at a particular moment in time, showing instances of classes and their relationships. It’s useful for demonstrating specific examples of class relationships.
-
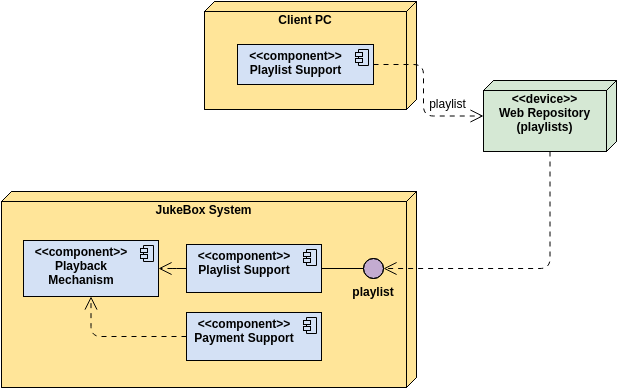
Component Diagram: Illustrates the organization and dependencies among software components, showing how they connect and interact to form a larger system.
-
Deployment Diagram: Shows the physical deployment of artifacts (e.g., software executables, libraries) on nodes (e.g., hardware devices, operating systems). It visualizes the system’s runtime architecture.
-
Package Diagram: Organizes model elements into groups (packages) and shows their dependencies. This helps in managing the complexity of large systems by breaking them into logical units.
-
Composite Structure Diagram: Represents the internal structure of a classifier (like a class or a component), including its parts, ports, and connectors. It’s useful for detailing complex internal structures.
Behavioral Diagrams: What the System Does
These diagrams focus on the dynamic aspects of a system, illustrating its behavior over time.
-
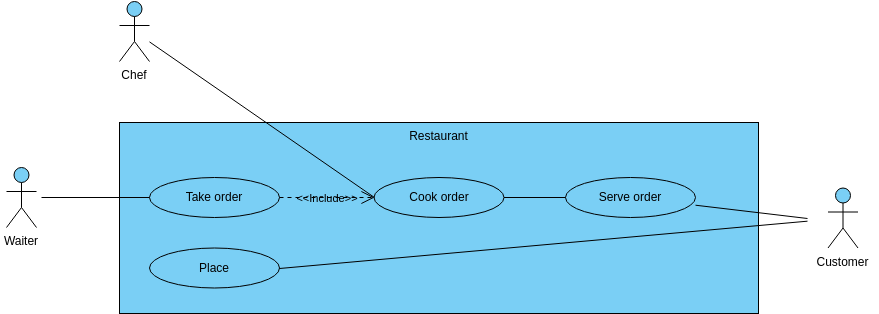
Use Case Diagram: Describes the functionality of a system from the user’s perspective, showing actors and the use cases (functions) they perform. It’s excellent for capturing system requirements and scope.
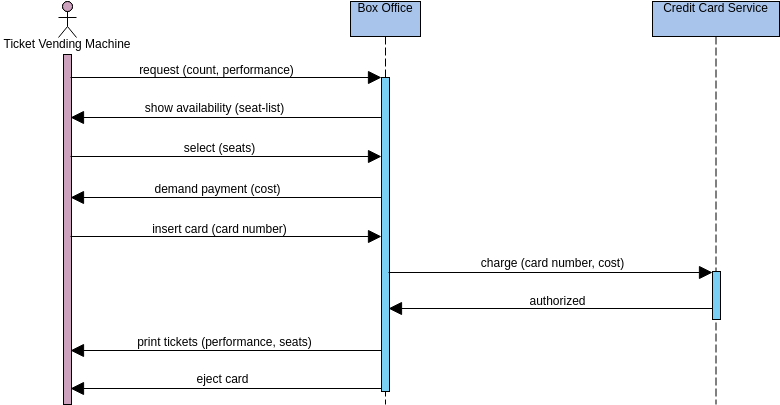
-
Sequence Diagram: Shows the interactions between objects in a time-ordered sequence. It’s highly effective for illustrating the flow of messages between objects in a particular scenario.
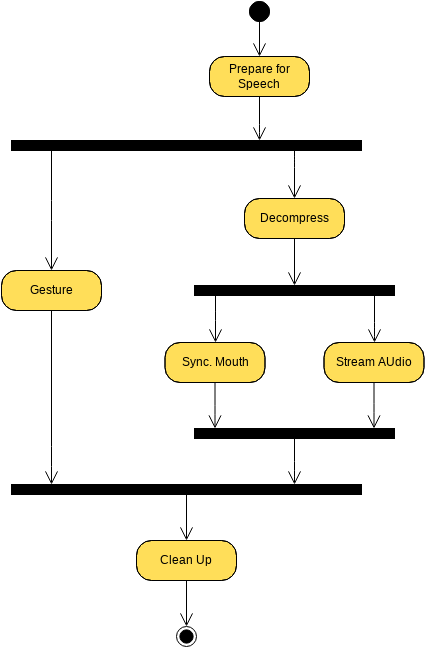
-
Activity Diagram: Models the flow of control or object flow within a system, depicting the sequence of activities that need to be performed to achieve a goal. It’s similar to a flowchart but with more advanced capabilities.
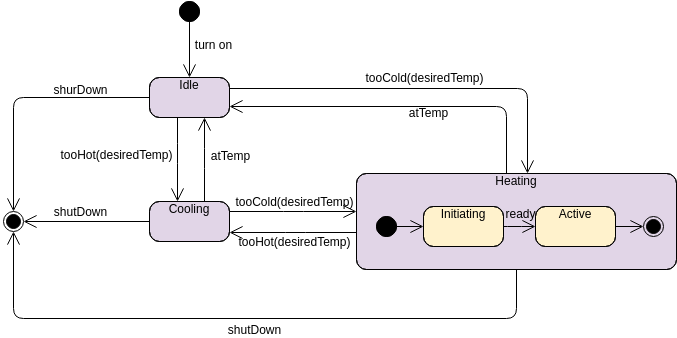
-
State Machine Diagram (Statechart Diagram): Describes the behavior of an object as it transitions through various states in response to events. It’s essential for modeling objects with complex lifecycle behaviors.
To explore UML further and see how AI can help you visualize it, visit our UML resource hub.
This post is also available in Deutsch, Español, فارسی, Français, English, Bahasa Indonesia, 日本語, Polski, Portuguese, Ру́сский, Việt Nam, 简体中文 and 繁體中文.