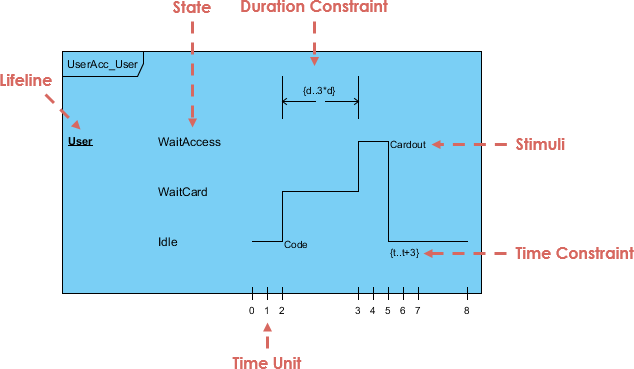
Unified Modeling Language (UML) Timing Diagrams are a type of interaction diagram that focuses on the timing constraints of objects within a system. These diagrams are particularly useful for real-time systems where the timing and duration of events are critical. This article will explain the key concepts of UML Timing Diagrams using the attached image as a reference.
Key Concepts of UML Timing Diagrams

1. Lifeline
The lifeline represents the existence of an object or a participant over time. In the attached image, the lifeline is labeled as “User/Acc_User” and extends vertically, indicating the duration for which the user exists in the system.
2. State
States are the conditions or situations in which an object can exist. In the diagram, different states such as “Idle,” “WaitCard,” “WaitAccess,” and “Cardout” are depicted. Each state represents a specific phase in the user’s interaction with the system.
3. Duration Constraint
Duration constraints specify the amount of time an object spends in a particular state. In the image, the duration constraint is indicated by the interval [d..3d], which means the user can be in the “WaitAccess” state for a duration between d and 3d time units.
4. Time Constraint
Time constraints define the timing relationships between different events. In the diagram, the time constraint is shown as [t..t+3], indicating that the transition from “Code” to “Cardout” must occur within t to t+3 time units.
5. Stimuli
Stimuli are external events or signals that trigger state changes. In the image, the stimuli are represented by the transitions between states, such as the transition from “WaitCard” to “Code” and from “Code” to “Cardout.”
6. Time Unit
The time unit is the basic measurement of time in the diagram. In the attached image, the time unit is represented on the horizontal axis, with increments from 0 to 8. This axis helps in visualizing the timing and duration of various states and transitions.
Interpreting the UML Timing Diagram
- Initial State: The user starts in the “Idle” state.
- WaitCard State: The user transitions to the “WaitCard” state, waiting for a card to be presented.
- Code State: Upon receiving the card, the user moves to the “Code” state, where some processing or verification occurs.
- WaitAccess State: The user then enters the “WaitAccess” state, waiting for access to be granted. The duration constraint [d..3*d] indicates the permissible waiting time.
- Cardout State: Finally, the user transitions to the “Cardout” state, indicating that the card has been processed and access has been granted. The time constraint [t..t+3] ensures that this transition occurs within the specified time frame.
Applications of UML Timing Diagrams
UML Timing Diagrams are essential in various domains, including:
- Real-Time Systems: Systems where timing is critical, such as embedded systems, control systems, and communication protocols.
- Performance Analysis: Analyzing the performance of software systems to ensure they meet timing requirements.
- Simulation and Testing: Simulating and testing the behavior of systems under different timing constraints.
Alternative Presentation of a UML Timing Diagram
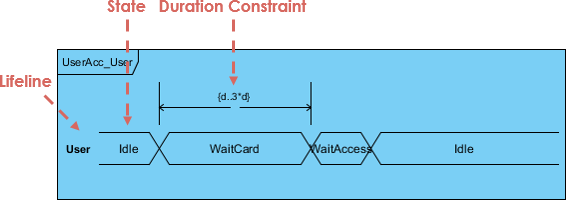
UML Timing Diagrams can be presented in different styles while conveying the same information. The alternative presentation in the second image simplifies the visual representation by focusing on the states and duration constraints without explicitly showing the stimuli and time constraints. Below, we will discuss the alternative presentation and explain how the two diagrams are equivalent.
Key Elements in the Alternative Presentation

- Lifeline: The lifeline remains the same, representing the existence of the “User/Acc_User” over time.
- States: The states “Idle,” “WaitCard,” “WaitAccess,” and “Idle” are clearly depicted. The user transitions through these states sequentially.
- Duration Constraint: The duration constraint [d..3*d] is shown for the “WaitAccess” state, indicating the permissible waiting time.
Equivalence of the Two Diagrams
- Lifeline: Both diagrams have a lifeline representing the “User/Acc_User” over the same time span.
- States: The sequence of states is identical in both diagrams: “Idle” → “WaitCard” → “WaitAccess” → “Idle.”
- Duration Constraint: Both diagrams specify the duration constraint [d..3*d] for the “WaitAccess” state.
- Implicit Time Constraints: Although the alternative presentation does not explicitly show the time constraints, they are implicitly understood. The transitions between states occur sequentially, and the duration constraints ensure that the timing requirements are met.
Detailed Comparison
- Initial State: Both diagrams start with the “Idle” state.
- WaitCard State: The transition to the “WaitCard” state is shown in both diagrams, indicating the user is waiting for a card.
- WaitAccess State: The “WaitAccess” state with the duration constraint [d..3*d] is present in both diagrams, ensuring the user waits for the specified duration.
- Final State: Both diagrams return to the “Idle” state after the “WaitAccess” state, completing the cycle.
Advantages of the Alternative Presentation
- Simplicity: The alternative presentation is simpler and easier to understand, focusing on the essential elements without additional details.
- Clarity: By omitting explicit stimuli and time constraints, the diagram becomes less cluttered, making it easier to visualize the state transitions and duration constraints.
Conclusion
UML Timing Diagrams provide a visual representation of the timing and duration constraints of objects within a system. By understanding the key concepts such as lifelines, states, duration constraints, time constraints, stimuli, and time units, developers can effectively model and analyze the behavior of real-time systems. The attached image serves as a practical example, illustrating how these concepts are applied in a typical scenario.

