


In the realm of software engineering and systems architecture, visualizing the high-level structure of a system is as critical as understanding its code. A UML Component Diagram serves this precise purpose. As a core structural diagram within the Unified Modeling Language (UML), it focuses on the physical or implementation view of a system. Unlike class diagrams that delve into internal logical structures, component diagrams provide a modular perspective, illustrating how replaceable, encapsulated components fit together to form a cohesive architecture.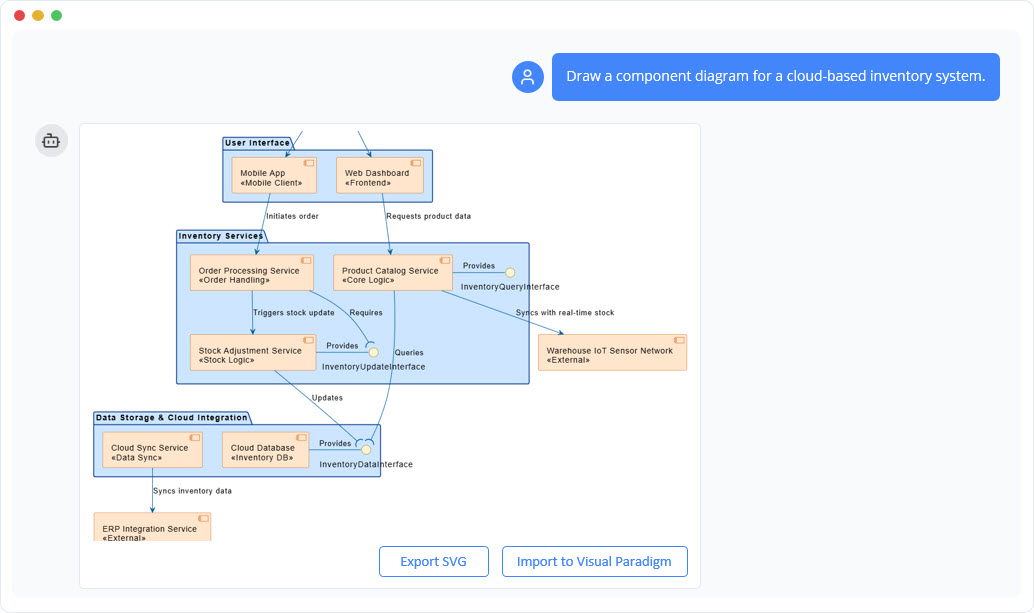
What is a UML Component Diagram?
A UML Component Diagram models the software system by breaking it down into smaller, manageable units known as components. These diagrams depict the wiring of a system by showing dependencies between software components, their interfaces (both provided and required), and relationships between them. They are particularly valuable in Component-Based Development (CBD), Service-Oriented Architectures (SOA), and modern microservices environments where modularity and reusability are paramount.
The primary goal is to visualize how components interact via well-defined interfaces without exposing their internal implementation details. This abstraction allows architects to focus on system topology, coupling, and deployment units.
The Purpose and Benefits
Component diagrams are versatile tools used during architectural design, system integration, and documentation phases. Their key objectives include:
- Visualizing Component-Based Systems: They specify and document the high-level static structure of deployable units such as libraries, executables, files, and API services.
- Managing Dependencies: By clearly mapping out how components rely on one another, these diagrams help identify potential coupling issues and circular dependencies.
- Facilitating Engineering: They support forward engineering (generating code skeletons from models) and reverse engineering (visualizing existing codebases).
- Promoting Reusability: By defining strict interfaces, components become swappable modules, making it easier to integrate third-party solutions or update parts of a system without affecting the whole.
Key Elements and Notation
To read or create a component diagram effectively, one must understand the standard UML 2.x notation. Below is a breakdown of the primary elements:
| Element | Description | Notation Style |
|---|---|---|
| Component | A modular, replaceable part of a system that encapsulates its contents and functionality. | A rectangle containing the keyword <<component>> or a small component icon in the top-right corner. |
| Provided Interface | Services or operations that a component offers to other clients (what it “provides”). | Represented by a “Lollipop” symbol—a complete circle connected to the component boundary. |
| Required Interface | Services or operations that a component needs from others to function (what it “requires”). | Represented by a “Socket” symbol—a half-circle connected to the component boundary. |
| Port | An interaction point on the boundary of a component where interfaces are exposed. | A small square on the edge of the component rectangle. |
| Connector | The link between components, typically connecting a provided interface to a required interface. | A solid line linking the ball (lollipop) and socket symbols, or a dependency arrow. |
| Artifact | A physical piece of information, such as a file or executable, manifested by the component. | A rectangle labeled with the keyword <<artifact>>. |
Understanding Relationships
The interactions between components are defined by specific relationship types:
- Realization: Indicates that a component implements a specific interface. This is often drawn as a dashed line with a hollow triangle or via the lollipop symbol.
- Dependency (Usage): Represents a scenario where one element requires another to function. It is depicted as a dashed arrow with an open head pointing toward the provider.
- Assembly Connector: A direct “wiring” between a provided interface and a required interface, often visualized as a ball-and-socket connection.
- Delegation Connector: Used primarily in composite structures to show how an external request is delegated to an internal sub-component.
Real-World Examples
To illustrate how these diagrams apply to actual development scenarios, consider the following examples:
1. Simple Online Shopping System
In a basic e-commerce architecture, the diagram would highlight the dependencies between the frontend and backend services:
- Web Frontend: Requires interfaces for
User AuthenticationandProduct Catalog. - Shopping Cart Service: Provides the
Cart Managementinterface but requires theProduct Catalog(to look up items) andPayment Processing. - Inventory Database: Provides the
Product Cataloginterface. - Payment Gateway: An external component providing the
Payment Processinginterface.
2. Library Management System
This example demonstrates how a central service manages logic by interacting with peripheral data sources:
- User Interface: Depends on
Book SearchandLoan Management. - Loan Service: Acts as the core logic provider for
Loan Management. It requires access to theBook Catalogto check availability andUser Authenticationto validate borrowers. - Database: The foundational component providing raw
Database Accessto the catalog and user services.
3. Microservices Architecture
For cloud-native applications, component diagrams are essential for mapping service meshes:
- API Gateway: The entry point providing the external API while requiring multiple internal microservices.
- Order Service: A complex component that requires the
User Servicefor customer data, thePayment Servicefor transactions, and theInventory Servicefor stock updates. - Message Queue: A component used to facilitate asynchronous, event-driven communication between services.
Modern Tooling and AI Integration
Creating UML component diagrams has evolved beyond manual drawing. Tools like Visual Paradigm now offer advanced features, including AI-powered generation. With an AI Chatbot integration, architects can simply describe a system in natural language—for example, “Create a component diagram for a food delivery app with a restaurant service, delivery tracking, and payment gateway.”

The AI interprets this request and generates a draft diagram complete with components, ports, and interface connections. Users can then refine the model conversationally, adding specific constraints or missing dependencies. This workflow significantly accelerates the design phase and helps ensure strict adherence to UML 2.x standards.
Best Practices for Effective Modeling
To maximize the value of your component diagrams, follow these best practices:
- Maintain High-Level Abstraction: Avoid cluttering the diagram with internal class details. Focus on the architectural view.
- Define Clear Interfaces: Always specify provided and required interfaces. This enforces the concept of encapsulation and makes components truly modular.
- Use Stereotypes: Label components with stereotypes like
<<service>>,<<database>>, or<<library>>to immediately convey their technical nature. - Isolate Concerns with Ports: For complex components, use ports to group related interfaces, making the wiring easier to trace.
- Focus on Replaceability: Design components so that if one is removed, another can take its place as long as it fulfills the same interface contract.
By mastering UML Component Diagrams, software architects and developers can ensure their systems are designed for scalability, maintainability, and robust integration.
The following articles and tutorials provide detailed information on using AI-powered tools to create and refine UML and C4 component diagrams within the Visual Paradigm platform:
-
Major Upgrade to AI UML Component Diagram Generation in Visual Paradigm AI Chatbot: The Visual Paradigm AI Chatbot now offers advanced capabilities for generating UML component diagrams directly from natural language prompts.
-
AI-Powered Component Diagrams with Visual Paradigm Chatbot: This tool simplifies the creation of component diagrams by transforming natural language descriptions into precise and ready-to-use models.
-
AI-Generated UML Component Diagrams: Artificial intelligence assistance enables the accurate and efficient creation of UML component diagrams for modern software design.
-
UML Component Diagram Tutorial and Tool – Visual Paradigm: This resource provides an interactive guide for using AI tools to model system architecture and various component relationships.
-
Why Every Team Needs an AI Diagram Maker for Faster Project Kickoff: This article explains how AI-powered modeling tools accelerate project initiation by automating the creation of UML and component diagrams.
-
UML Component Diagram Tutorial: Building Modular Software Systems: This video guide explores how to use AI and generative tools to model the modular structure of software systems through component diagrams.
-
UML Component Diagram Tutorial: Designing Software Architecture: This step-by-step tutorial covers the creation of UML component diagrams to visualize software modularity and dependencies.
-
UML Component Diagram Tutorial: Building Modular Software Systems: This resource offers a comprehensive guide to creating UML component diagrams for effectively modeling complex modular software structures.
-
UML Component Diagram Tutorial: Building Modular Software Systems: This video demonstrates how to use generative AI features to assist in the creation of modular software architecture diagrams.
This post is also available in Deutsch, Español, فارسی, Français, English, Bahasa Indonesia, 日本語, Polski, Portuguese, Ру́сский, Việt Nam, 简体中文 and 繁體中文.