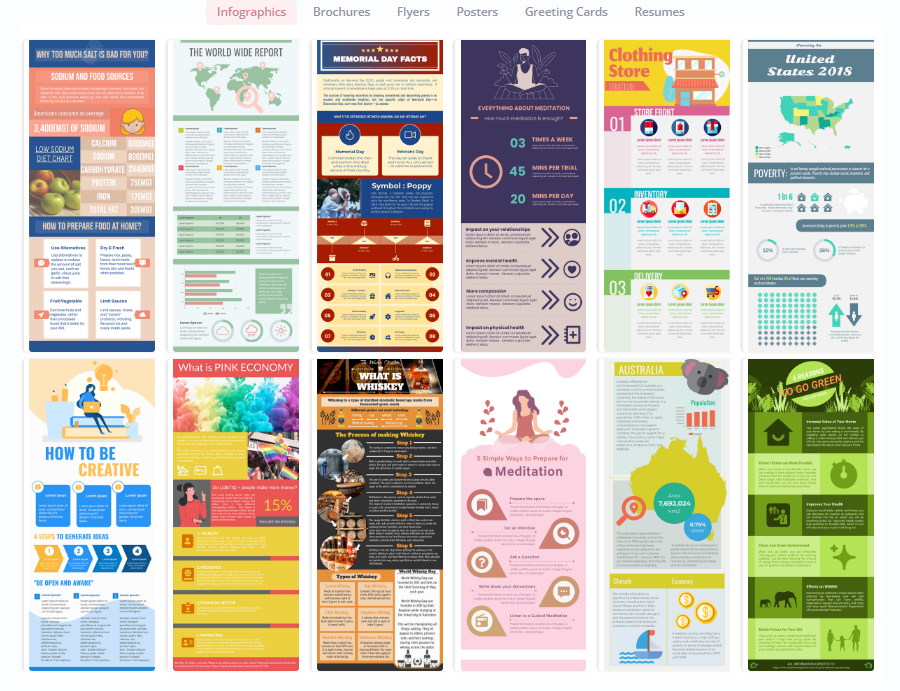
Data is everywhere, and in today’s digital age, we have access to more data than ever before. But how do we make sense of all this information? How do we turn raw numbers into meaningful insights? The answer lies in the power of data visualization.
Data visualization is the art of representing data in a visual format, such as charts, graphs, and maps. It allows us to see patterns, trends, and relationships that might not be apparent in raw data alone. By transforming numbers into visual elements, we can quickly grasp complex concepts, identify outliers, and make informed decisions.

The Benefits of Data Visualization
- Enhanced Understanding
Data visualization simplifies complex information by presenting it in a visual format. Instead of poring over spreadsheets and tables, we can instantly grasp the main takeaways from a well-designed graph or chart. This enhances our understanding of the data and enables us to communicate insights more effectively. - Spotting Trends and Patterns
Visualizing data helps us identify trends and patterns that might otherwise go unnoticed. By plotting data points over time or geographical locations, we can uncover correlations, anomalies, and outliers. These insights can be invaluable for businesses, researchers, and decision-makers. - Improved Decision-Making
When presented with data in a visual format, decision-makers can quickly absorb the information and make informed choices. Visualizations provide a clear and concise representation of the data, enabling stakeholders to understand complex situations and make decisions with confidence. - Effective Communication
Data visualization is a powerful tool for effective communication. Instead of overwhelming an audience with numbers and statistics, visualizations enable us to tell compelling stories with data. Whether it’s a sales presentation, a scientific report, or a marketing campaign, visualizations can captivate and engage the audience, making the data more memorable and impactful.

Key Points for Creating Effective Data Visualizations
- Choose the Right Visualization Type
Different types of data require different visualization techniques. Bar charts, line graphs, and scatter plots are just a few examples of visualization options. Understanding the nature of your data and the insights you want to convey to choose the most appropriate visualization type. - Use Color and Design Thoughtfully
Color and design play a crucial role in data visualization. Use color strategically to highlight important data points or to differentiate between categories. Choose a visually pleasing design that enhances the overall clarity and aesthetics of the visualization. - Provide Context and Interpretation
Data visualizations should not stand alone. Provide context and interpretation to help viewers understand the significance of the data. Include clear labels, titles, and captions that guide the audience through the visualization and highlight the key insights.
Whether you’re a business professional, a researcher, or simply someone interested in understanding the world around you, embracing data visualization will empower you to see beyond the numbers and uncover valuable insights.
So, next time you find yourself drowning in a sea of data, remember the power of data visualization. It’s not just about pretty charts and graphs; it’s about unlocking the hidden stories within the numbers and turning them into actionable insights.

