
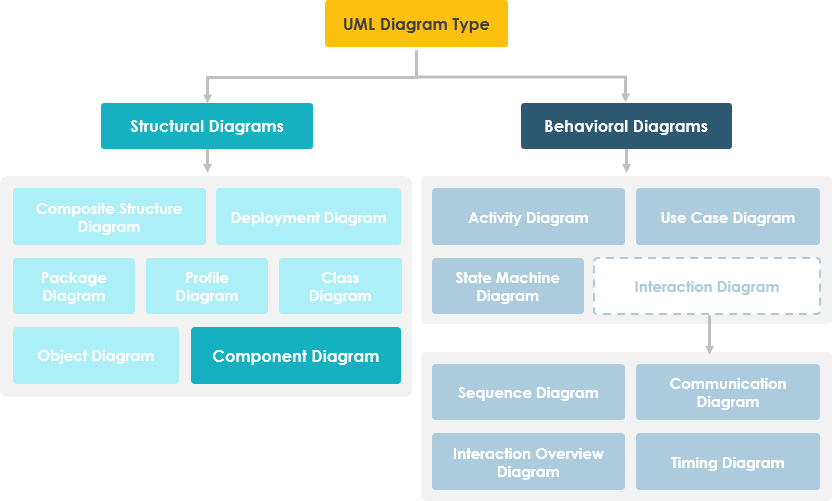
Introduction to UML Component Diagrams
Unified Modeling Language (UML) Component diagrams are used in modeling the physical aspects of object-oriented systems that are used for visualizing, specifying, and documenting component-based systems and also for constructing executable systems through forward and reverse engineering. Component diagrams are essentially class diagrams that focus on a system’s components that often used to model the static implementation view of a system.
Learn UML Faster, Better and Easier
Are you looking for a Free UML tool for learning UML faster, easier and quicker? Visual Paradigm Community Edition is a UML software that supports all UML diagram types. It is an international award-winning UML modeler, and yet it is easy-to-use, intuitive & completely free.
Component Diagram at a Glance
A component diagram breaks down the actual system under development into various high levels of functionality. Each component is responsible for one clear aim within the entire system and only interacts with other essential elements on a need-to-know basis.
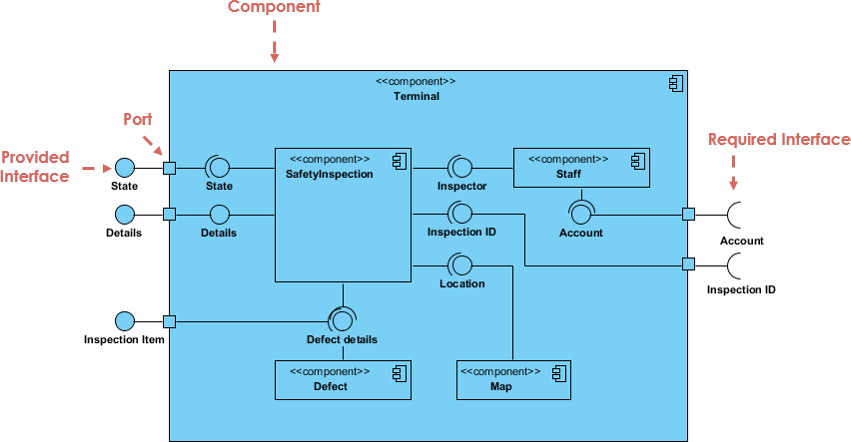
The example above shows the internal components of a larger component:
-
Data Flow: The data (account and inspection ID) flows into the component via the port on the right-hand side and is converted into a format the internal components can use. The interfaces on the right are known as required interfaces, which represents the services the component needed in order to carry out its duty.
-
Output Processing: The data then passes to and through several other components via various connections before it is output at the ports on the left. Those interfaces on the left are known as provided interface, which represents the services to deliver by the exhibiting component.
-
Component Boundaries: It is important to note that the internal components are surrounded by a large ‘box’ which can be the overall system itself (in which case there would not be a component symbol in the top right corner) or a subsystem or component of the overall system (in this case the ‘box’ is a component itself).
Basic Concepts of Component Diagram
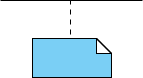
A component represents a modular part of a system that encapsulates its contents and whose manifestation is replaceable within its environment. In UML 2, a component is drawn as a rectangle with optional compartments stacked vertically. A high-level, abstracted view of a component in UML 2 can be modeled as:
-
A rectangle with the component’s name
-
A rectangle with the component icon
-
A rectangle with the stereotype text and/or icon

Architect Your Modular Systems with AI
Component diagrams visualize the modular parts and physical manifestation of your system. Using Visual Paradigm’s AI Chatbot, you can instantly brainstorm system architectures, identify provided/required interfaces, and generate initial component diagrams through a simple conversational interface.
NOW AVAILABLE: AI Chatbot – Your Design Partner
Simply describe your modules, microservices, or database structures to the chatbot. It will help you define:
-
Modular Boundaries: Identify which parts of your system should be encapsulated as components.
-
Dependency Mapping: Visualize how different executables and libraries interact within your release.
Learn more about our AI-driven modeling ecosystem:
AI Component Guide | All AI Tools
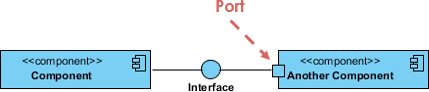
Interface
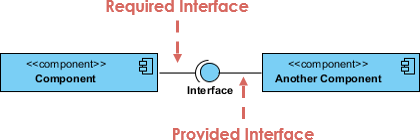
In the example below shows two type of component interfaces:
-
Provided Interface: Symbols with a complete circle at their end represent an interface that the component provides – this “lollipop” symbol is shorthand for a realization relationship of an interface classifier.
-
Required Interface: Symbols with only a half circle at their end (a.k.a. sockets) represent an interface that the component requires (in both cases, the interface’s name is placed near the interface symbol itself).
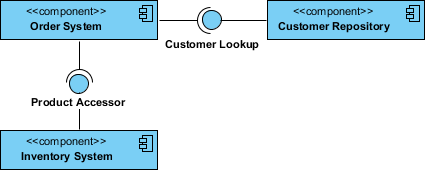
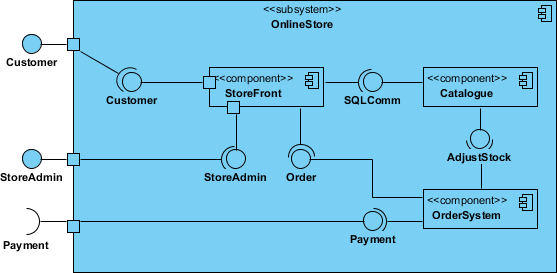
Component Diagram Example – Using Interface (Order System)
Subsystems
The subsystem classifier is a specialized version of a component classifier. Because of this, the subsystem notation element inherits all the same rules as the component notation element. The only difference is that a subsystem notation element has the keyword of subsystem instead of component.
Port
Ports are represented using a square along the edge of the system or a component. A port is often used to help expose required and provided interfaces of a component.
Relationships
Graphically, a component diagram is a collection of vertices and arcs and commonly contain components, interfaces and dependency, aggregation, constraint, generalization, association, and realization relationships. It may also contain notes and constraints.
| Relationships | Notation |
|---|---|
Association:
|
 |
Composition:
|
 |
Aggregation:
|
 |
Constraint:
|
 |
Dependency:
|
 |
Generalization:
|
 |
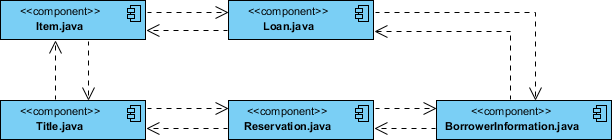
Modeling Source Code
-
Either by forward or reverse engineering, identify the set of source code files of interest and model them as components stereotyped as files.
-
For larger systems, use packages to show groups of source code files.
-
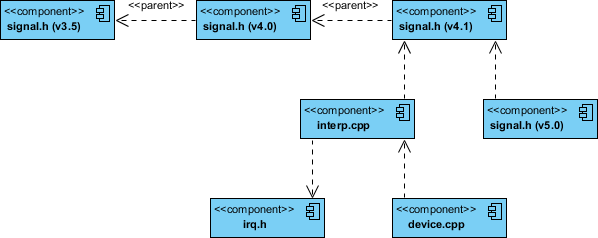
Consider exposing a tagged value indicating such information as the version number of the source code file, its author, and the date it was last changed. Use tools to manage the value of this tag.
-
Model the compilation dependencies among these files using dependencies. Again, use tools to help generate and manage these dependencies.
Component Example – Java Source Code
Component Diagram Example – C++ Code with Versioning
Modeling an Executable Release
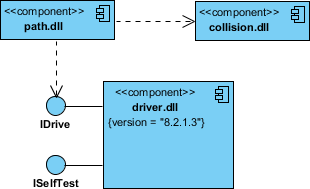
-
Identify the set of components you’d like to model. Typically, this will involve some or all the components that live on one node, or the distribution of these sets of components across all the nodes in the system.
-
Consider the stereotype of each component in this set. For most systems, you’ll find a small number of different kinds of components (such as executables, libraries, tables, files, and documents). You can use the UML’s extensibility mechanisms to provide visual cues for these stereotypes.
-
For each component in this set, consider its relationship to its neighbors. Most often, this will involve interfaces that are exported (realized) by certain components and then imported (used) by others. If you want to expose the seams in your system, model these interfaces explicitly. If you want your model at a higher level of abstraction, elide these relationships by showing only dependencies among the components.
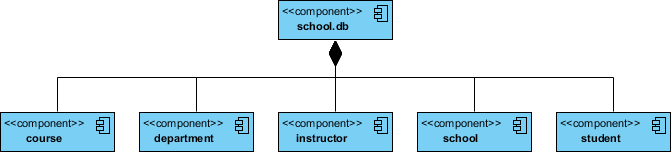
Modeling a Physical Database
-
Identify the classes in your model that represent your logical database schema.
-
Select a strategy for mapping these classes to tables. You will also want to consider the physical distribution of your databases. Your mapping strategy will be affected by the location in which you want your data to live on your deployed system.
-
To visualize, specify, construct, and document your mapping, create a component diagram that contains components stereotyped as tables.
-
Where possible, use tools to help you transform your logical design into a physical design.
Try to Draw UML Component Diagram Now
You’ve learned what a Component Diagram is and how to draw a Component Diagram. It’s time to draw a Component Diagram of your own. Get Visual Paradigm Community Edition, a free UML software, and create your own Component Diagram with the free Component Diagram tool. It’s easy-to-use and intuitive.
AI Powered Component Diagram Tool
New Release: Generate UML Component Diagrams with AI in Visual Paradigm
We are excited to announce a significant update to Visual Paradigm Desktop. To further empower software architects and developers, we have integrated advanced generative capabilities into our modeling environment. You can now use our AI component diagram generator to transform textual descriptions into structured UML models instantly.
As systems grow in complexity, visualizing the modular organization of your software becomes critical. This new AI UML tool is designed to reduce the manual effort of drawing components, interfaces, and dependencies, allowing you to focus on high-level design and architectural integrity.
How to Use the AI UML Generator
The process of creating a component diagram with AI is seamless and integrated directly into your existing workflow. Follow these simple steps to get started:
-
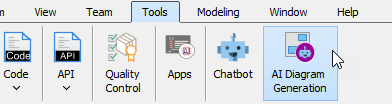
Navigate to the Tools menu and select AI Diagram Generation. This will open the AI Diagram Generation dialog box.
-
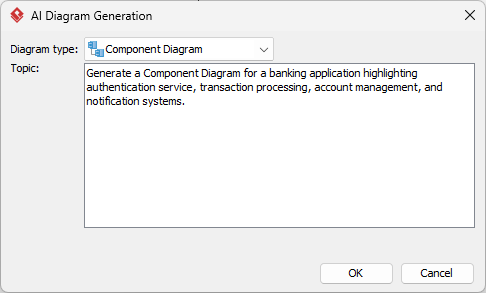
From the dropdown menu, select Component Diagram as your desired diagram type.
-
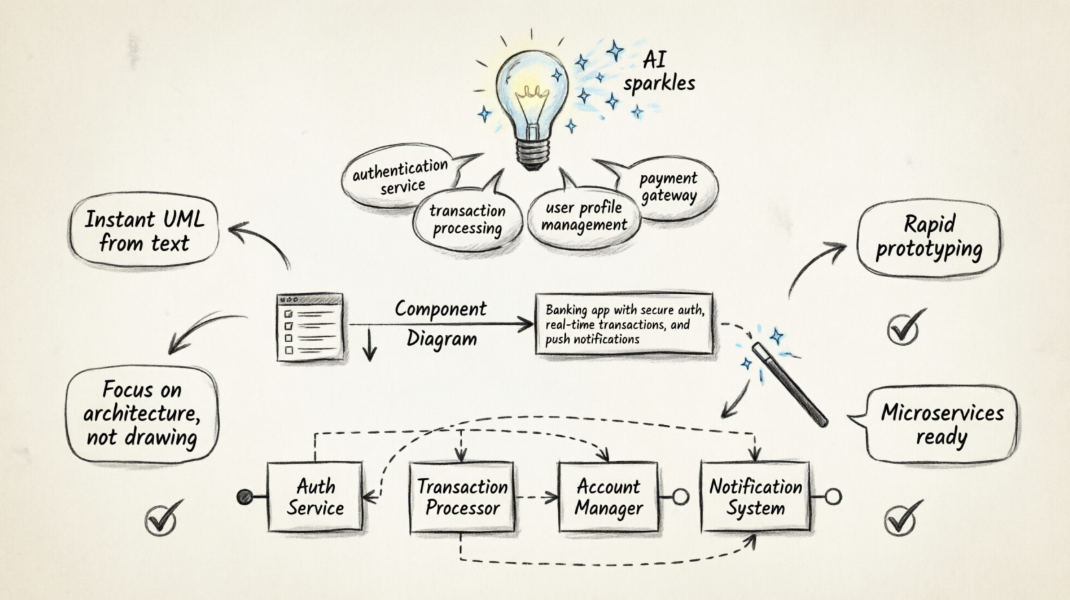
Enter your topic or prompt in the text field. For example: “Generate a Component Diagram for a banking application highlighting authentication service, transaction processing, account management, and notification systems.”
-
Click OK.
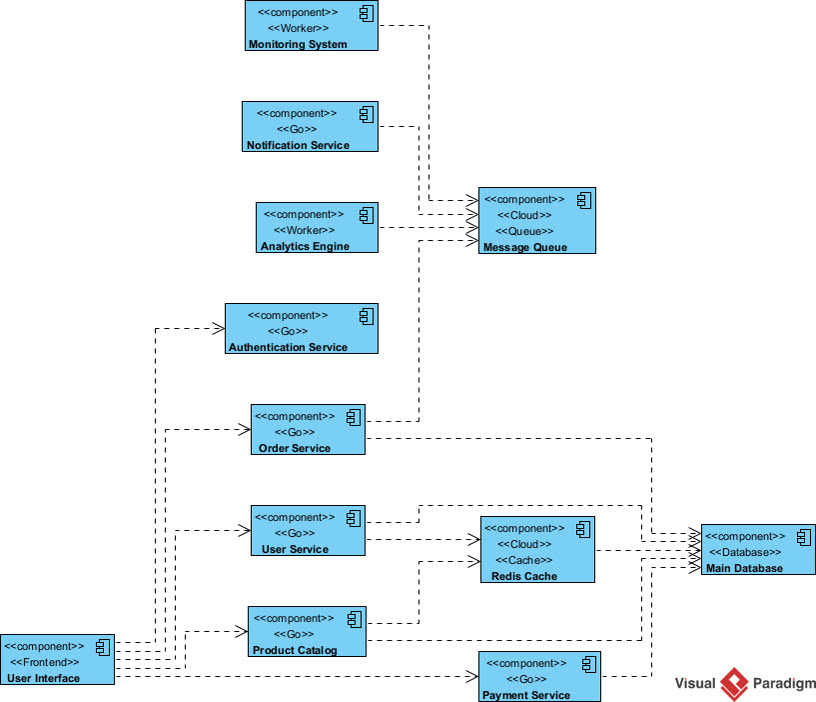
Within seconds, our AI diagram generator will produce a comprehensive visual representation of your system. Once the diagram is generated, you have full flexibility to revise the elements, refine the layout, and continue your modeling process using Visual Paradigm’s robust suite of editing tools.
Why Use an AI Component Diagram Generator?
Efficiency is the core of modern development. By utilizing an AI UML generator, you can quickly prototype system architectures during brainstorming sessions or initial requirements gathering. This tool ensures that your team stays agile, moving from concept to visualization faster than ever before.
Whether you are documenting a legacy system or planning a new microservices architecture, this feature provides a solid foundation for your technical documentation.
Visual Paradigm’s AI Component Diagram Feature Overview
Visual Paradigm’s AI Component Diagram feature automates the creation of high-level software architecture diagrams by converting natural language system descriptions into structured UML models. It is available across the Visual Paradigm ecosystem, including the Desktop application, Online editor, and OpenDocs workspace.
Key AI Support Features
-
Instant Text-to-Diagram Generation: You can generate a complete component diagram by simply typing a prompt, such as “Generate a Component Diagram for a banking application highlighting authentication and transaction processing”.
-
Automated UML Notation: The AI automatically applies correct UML symbols for components, ports, provided/required interfaces (lollipops and sockets), and connectors.
-
Conversational Refinement: After the initial generation, you can use the AI Chatbot to add new components, rename existing ones, or restructure dependencies through simple chat commands without manual drawing.
-
Architectural Analysis: The AI can detect potential design issues like tight coupling or circular dependencies through conversational analysis of the model.
-
C4 Model Support: Beyond standard UML, the AI can specifically generate C4 Component Diagrams to visualize the internal structure of containers and microservices.
How to Use the AI Component Diagram Tool
| Method | Steps to Access |
|---|---|
| Desktop App | Go to Tools > AI Diagram Generation, select Component Diagram, and enter your prompt. |
| OpenDocs | Click Insert > Diagrams > Component Diagram, then click Create with AI at the top right. |
| AI Chatbot | Type your request (e.g., “Create a component diagram for a social media platform”) directly into the Visual Paradigm AI Chatbot. |
UML Component Diagram – AI Chatbot
AI Chatbot | Diagramming & Modeling with Visual Paradigm
💡 Tip: Would you like a sample prompt tailored to a specific type of system, such as a microservices architecture or an e-commerce platform? Just ask!
- References
- AI Component Diagram Generator – OpenDocs Update: Announcement of AI-powered component diagram generation capabilities added to Visual Paradigm OpenDocs workspace.
- AI Component Diagram Generator Update – Desktop Release: Details on the integration of generative AI for creating UML component diagrams in Visual Paradigm Desktop.
- Visual Paradigm Desktop – AI-Powered Features Overview: Product page highlighting AI-powered apps, chatbot integration, and web diagram editors available with Visual Paradigm Desktop licenses.
- VP Online Diagram Compatibility Guide: Documentation explaining VP Online (formerly VPository) as a cloud-based repository for team collaboration and diagram compatibility across platforms.
- Visual Paradigm AI Chatbot Features: Overview of the AI Chatbot capabilities for conversational diagram creation, refinement, and architectural analysis.
- UML Component Diagram – AI Chatbot Demo Page: Interactive page demonstrating how to generate UML component diagrams using the Visual Paradigm AI Chatbot.
- YouTube Tutorial: AI Component Diagram Generation (Video 1): Video tutorial demonstrating the step-by-step process of generating component diagrams using Visual Paradigm’s AI tools.
- YouTube Tutorial: AI Component Diagram Generation (Video 2): Additional video guide showcasing advanced use cases and refinement techniques for AI-generated component diagrams.