


UML, in its comprehensive toolkit for visualizing software systems, categorizes its numerous diagram types into two fundamental groups: structural diagrams and behavioral diagrams. This division is not arbitrary; it reflects the two core perspectives from which any complex system can be understood: what it is made of, and what it does. Grasping this distinction is key to effectively utilizing UML for designing, analyzing, and documenting software.
Structural Diagrams: What the System Is
Structural diagrams are concerned with the static aspects of a software system. They illustrate the elements of a system that are largely stable over time, focusing on the components that make up the system and how they are organized and related. Think of them as the blueprints and schematics of a building; they show the walls, rooms, pipes, and electrical wiring – the things that define the physical structure and its inherent connections, regardless of who is moving through it or what activities are taking place inside.
The primary goal of structural diagrams is to show the architecture of a system:
-
Components: The pieces or parts that constitute the system.
-
Relationships: How these components are connected, interact, or depend on one another.
-
Organization: How the system is arranged and grouped into logical or physical units.
By using structural diagrams, developers and architects can understand the system’s foundational elements, identify potential design flaws in its composition, and ensure that the various parts are correctly assembled to meet the overall requirements. They answer questions like: “What are the main classes in our application?“, “How do different modules connect?“, or “Where will the software physically run?“
Common structural diagrams include:
-
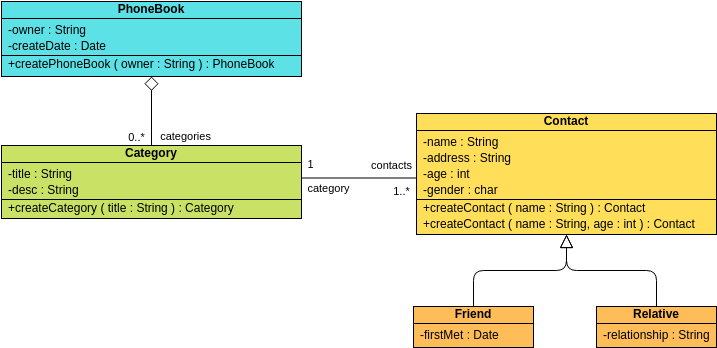
Class Diagram: Depicts the classes, interfaces, attributes, operations, and their relationships, forming the blueprint of the object-oriented design.
-
Object Diagram: Shows instances of classes and their relationships at a specific point in time, providing a concrete example of the class diagram’s abstract structure.
-
Component Diagram: Illustrates the organization and dependencies among software components, showing how they fit together to form the larger system.
-
Deployment Diagram: Visualizes the physical deployment of software artifacts on hardware nodes, mapping the software to its runtime environment.
-
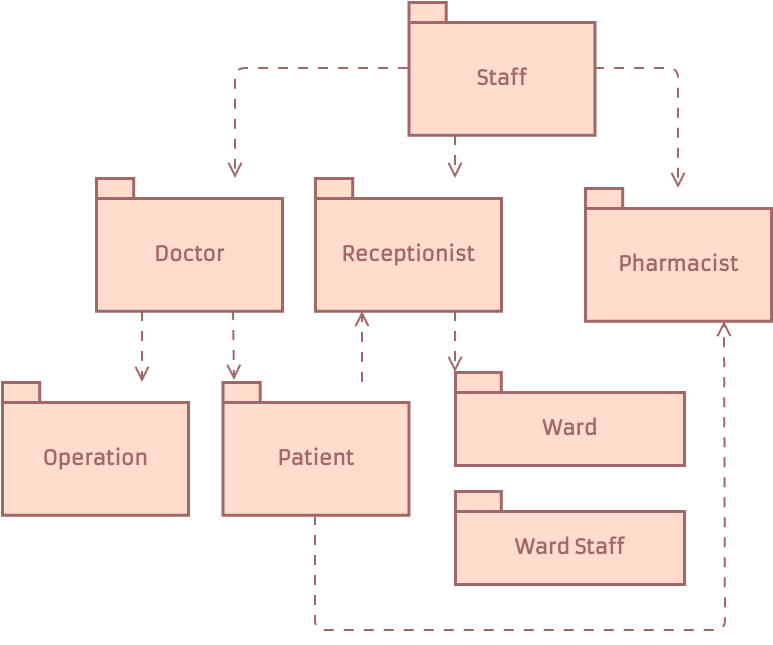
Package Diagram: Organizes model elements into logical groups (packages) and shows their dependencies, helping manage complexity in large systems.
-
Composite Structure Diagram: Details the internal structure of a classifier (like a class or a component), including its parts, ports, and connectors.
Behavioral Diagrams: What the System Does
In contrast to structural diagrams, behavioral diagrams focus on the dynamic aspects of a software system. They illustrate how the system acts, how its elements interact over time, and how it responds to various events and stimuli. If structural diagrams are the building’s blueprints, behavioral diagrams are like the walkthroughs, process flows, or usage instructions – they show how people or processes move through the building, what actions they take, and what happens as a result.

The primary goal of behavioral diagrams is to show the functionality and dynamics of a system:
-
Interactions: How different parts of the system or external users communicate and exchange information.
-
Processes: The sequence of steps or activities that occur within the system.
-
State Changes: How objects or the system itself transition between different states.
Behavioral diagrams are crucial for understanding the system’s operational aspects, validating requirements, and ensuring that the system behaves as expected. They help answer questions such as: “How does a user log in?“, “What steps occur when a payment is processed?“, or “How does an object change its status throughout its lifecycle?“
Common behavioral diagrams include:
-
Use Case Diagram: Describes the functionality of a system from an external user’s perspective, illustrating actors and the use cases they perform.
-
Sequence Diagram: Shows the time-ordered sequence of messages passed between objects to perform a specific function or scenario.
-
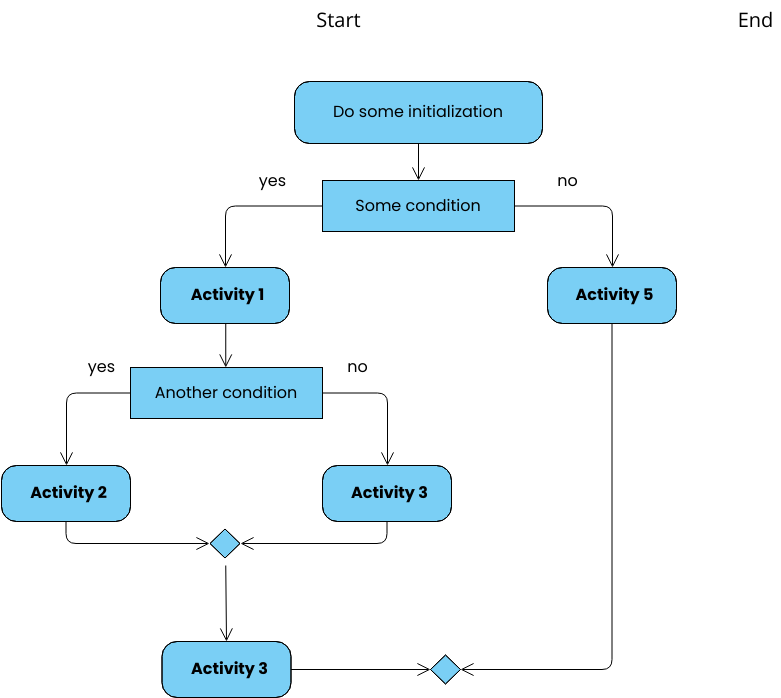
Activity Diagram: Models the flow of control or object flow, depicting the sequence of actions and decisions within a process.
-
State Machine Diagram (Statechart Diagram): Illustrates the behavior of an object or system by showing its states and the transitions between them based on events.
-
Communication Diagram (formerly Collaboration Diagram): Similar to a sequence diagram, but focuses on the structural organization of objects that send and receive messages.
-
Timing Diagram: A specialized interaction diagram that shows the changes in state or value of a classifier instance or role over time.
The Interplay
While distinct, structural and behavioral diagrams are often used together to provide a holistic view of a software system. A structural diagram might define the classes, while a behavioral diagram shows how instances of those classes interact to perform a task. For instance, a Class Diagram might show an Order class and a Customer class, while a Sequence Diagram illustrates the steps involved when a Customer places an Order.
Understanding the difference between these two categories empowers software professionals to choose the most appropriate diagram for the task at hand, leading to clearer communication, better design, and ultimately, more successful software projects.
If you want to dive deeper into UML and its AI-powered visualization options, head over to our UML resource hub.
This post is also available in Deutsch, Español, فارسی, Français, English, Bahasa Indonesia, 日本語, Polski, Portuguese, Ру́сский, Việt Nam, 简体中文 and 繁體中文.