
Introduction to State Diagrams
A state diagram consists of states, transitions, events, and activities. You use state diagrams to illustrate the dynamic view of a system. They are especially important in modeling the behavior of an interface, class, or collaboration. State diagrams emphasize the event-ordered behavior of an object, which is especially useful in modeling reactive systems.
You use state machines to model the behavior of any modeling element, although, most commonly, that will be a class, a use case, or an entire system which focuses on the event-ordered behavior of an object, which is especially useful in modeling reactive systems.

Key Concepts of State Machines
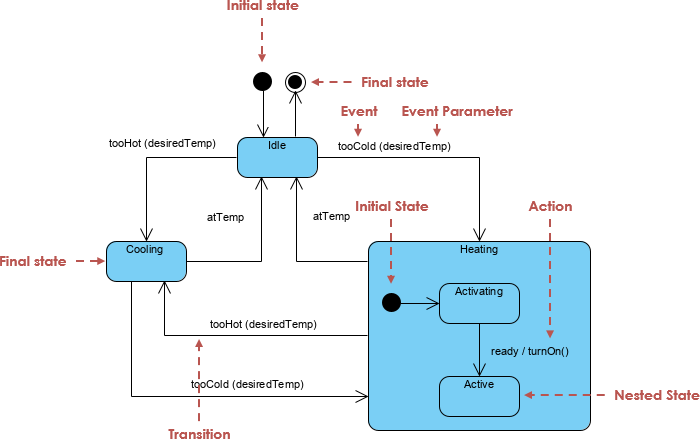
The Figure below shows the key elements of a state diagram in UML. This notation permits you to visualize the behavior of an object in a way that lets you emphasize the important elements in the life of that object.
A state machine is a behavior that specifies the sequences of states an object goes through during its lifetime in response to events, together with its responses to those events.
A state is a condition or situation during the life of an object during which it satisfies some condition, performs some activity, or waits for some event.
An event is the specification of a significant occurrence that has a location in time and space. In the context of state machines, an event is an occurrence of a stimulus that can trigger a state transition.
A guard condition is evaluated after the trigger event for the transition occurs. It is possible to have multiple transitions from the same source state and with the same event trigger, as long as the guard conditions don’t overlap. A guard condition is evaluated just once for the transition at the time the event occurs. The boolean expression may reference the state of the object.
A transition is a relationship between two states indicating that an object in the first state will perform certain actions and enter the second state when a specified event occurs and specified conditions are satisfied. Activity is an ongoing non-atomic execution within a state machine.
An action is an executable atomic computation that results in a change in the state of the model or the return of a value.
Graphically, a state is rendered as a rectangle with rounded corners. A transition is rendered as a solid directed line.
Activity vs State Machines
In UML semantics, Activity Diagrams are reducible to State Machines with some additional notations that the vertices represent the carrying out of an activity and the edges represent the transition on the completion of one collection of activities to the commencement of a new collection of activities.
Activity Diagrams capture high-level activities aspects. In particular, it is possible to represent concurrency and coordination in Activity Diagrams.
Take a look at the Activity Diagram which models the flow of actions for an incident. Such an Activity Diagram focuses on the flow of data within a system.
![]()
In State Machines the vertices represent states of an object in a class and edges represent occurrences of events. The additional notations capture how activities are coordinated. Objects have behaviors and states. The state of an object depends on its current activity or condition. A State Machine Diagrams shows the possible states of the object and the transitions that cause a change in state.
Take a look at the State Machine Diagram below. It models the transitioning of states for an incident. Such a state diagram focuses on a set of attributes of a single abstraction (object, system).
![]()
State Machine Diagram Example: A Toaster
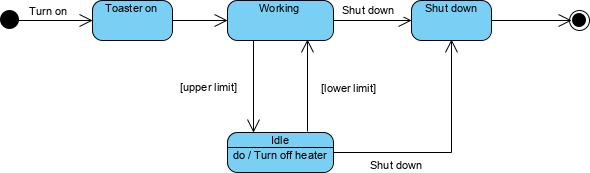
Suppose you’re designing a toaster. You would build plenty of UML diagrams, but here only state diagrams will be of our interest. Suppose we are interested to model:
“What are the steps of making a toast?”
First of all we must turn on the toaster, put in the bread and wait for several minutes to bake it. The initial state diagram is shown below:
Refine the State Machine to Cope With Burning Out
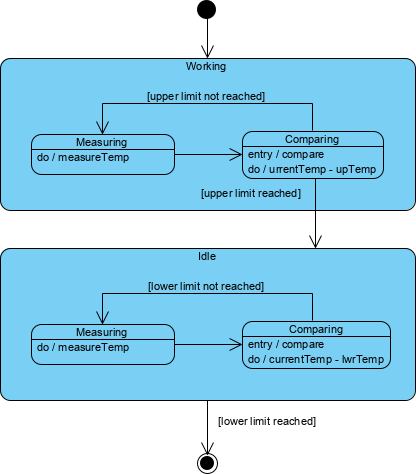
Let’s refine the state machine example above to prevent burning out the bread, heater of the toaster must produce heat in temperature interval (upper and lower temperature limits).
-
For this purpose, the thermometer measures the temperature of the heater, and when the upper limit of temperature is reached then heater must go into an idle state.
-
This state resists until the heater’s temperature decreases to a lower limit, and then the working state is again aimed.
With this new state, the extended state diagram will be:
Advanced State Machine Concepts
Refine Reactive Systems with AI
Building state diagrams for reactive systems requires constant refinement—from basic lifecycles to complex logic involving super-states and guard conditions. Visual Paradigm’s AI tools help you automate this evolution, ensuring your state machines are robust and logically sound.
How to Use Super-State / Sub-State for Toaster
We can partition working and idle as state and encapsulate the detailed state inside each of them. The transition will be made between working and ideal state:
Sub-states in working and idle states are very similar. Both of them measure and compare states, but differentiates in the process of temperature comparison.
In the toaster example above:
-
Working state must compare current temperature with upper-temperature limit (if it is reached, the working state goes into the idle state)
-
Idle state compares current temperature with a lower temperature limit (the idle state is replaced with the working state when the temperature falls under a lower limit).
Concurrent Sub-States and Regions
Concurrent Sub-states are independent and can complete at different times and each sub-state is separated from the others by a dashed line
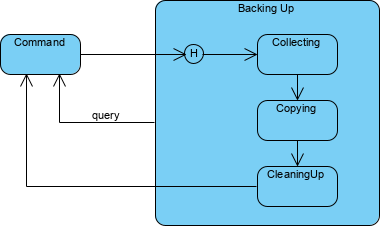
History States
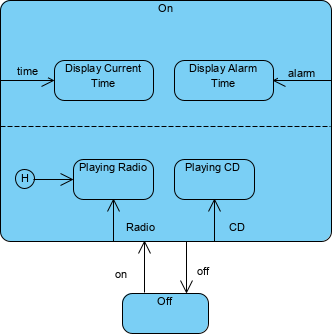
Unless otherwise specified, when a transition enters a composite state, the action of the nested state machine starts over again at the initial state (unless the transition targets a sub-state directly). History states allow the state machine to re-enter the last sub-state that was active prior to leaving the composite state. A history state is indicated by a circle with an H inside it that allows the re-entering of a composite state at the point which it was last left.
An example of history state usage is presented in Diagram below.
Associating State Diagram with a Class
You can associate a state machine with a class, which is especially useful when modeling event-driven systems or when modeling the lifetime of a class. In these cases, you can also show the state of this machine for a given object at a given time. For example, as class shows below, the object c (an instance of the class Phone) is indicated in the state WaitingForAnswer, a named state defined in the state machine for Phone.

AI-Powered Diagram Generatio
Visual Paradigm provides comprehensive support for both Activity and State Machine Diagrams, leveraging generative AI to bridge the gap between textual requirements and formal UML modeling.
AI Modeling Tools
-
VP Desktop: Seamlessly integrate AI-generated state logic into your professional class models and architectural designs.
-
AI Chatbot: Iteratively refine your toaster-like logic by chatting with the AI Chat to add new states, guards, and transitions.
Logic & Refinement
🔄 Iterative Refinement: AI automatically identifies states and transitions from your system requirements.
⏱️ Time-Saving: Generate diagram in one click, few seconds
AI Features for Activity Diagrams
Visual Paradigm’s AI specifically targets the transition from user requirements to process flows:
-
Use Case to Activity Diagram: A dedicated AI app that converts detailed use case narratives—including main flows, alternative flows, and exception cases—into structured activity diagrams.
-
Automatic Node Generation: The AI automatically identifies and creates actions, decisions, forks, joins, and control flows from your text.
-
Logic Optimization: Recent updates have enhanced the AI’s ability to remove “orphan” decision shapes and disconnected nodes, resulting in cleaner logical flows.
-
Refinement & Quality Checks: The AI can suggest missing steps, analyze flow quality, and identify potential inconsistencies in the process logic.
AI Features for State Machine Diagrams
For modeling object lifecycles and dynamic behavior, the AI offers specialized capabilities:
-
Natural Language Generation: Describe how an object (like a “Support Ticket” or “Order”) behaves in plain English, and the AI generates the states and transitions.
-
Advanced Behavioral Modeling: The AI now supports complex elements such as entry actions, event triggers, and guard conditions on transitions.
-
Intelligent Clustering: For intricate systems, the AI automatically groups related states into logical clusters to maintain readability.
-
Conversational Editing: You can use the Visual Paradigm AI Chatbot to modify diagrams—for example, by saying “add a reset state from error to idle”—and compare changes side-by-side.
Integrated Ecosystem
The strength of Visual Paradigm lies in how these AI-generated models fit into a professional engineering workflow:
-
Cross-Platform Synchronization: Diagrams created online or via chatbot can be imported directly into Visual Paradigm Desktop for advanced tasks like code engineering (Java, C#, Python) or team collaboration.
-
Traceability: Link your AI-generated diagrams to other artifacts like user stories in Jira or requirements in a traceability matrix.
-
Documentation on Demand: Automatically generate comprehensive project reports and technical documentation in PDF or Markdown format based on the generated visual models.
References
User Experience Sharing Journey
- Comprehensive Review: Visual Paradigm’s AI Diagram Generation Features: Real-world user experiences and detailed reviews of Visual Paradigm’s AI-powered diagram generation capabilities.
- Comprehensive Guide to Visual Paradigm’s AI-Powered UML and Modeling Ecosystem 2025-2026: Complete guide covering the latest AI features and modeling tools in Visual Paradigm’s ecosystem.
- How Visual Paradigm’s AI-Powered Ecosystem Transforms UML Development: Insights into how AI is revolutionizing traditional UML development workflows.
- Harnessing Visual Paradigm’s AI for Diagram Generation: The Ultimate 2026 Guide: Comprehensive 2026 guide to leveraging AI for automated diagram generation.
Absolutely Beginners Guide
- Use Case to Activity Diagram: Official guide on converting use cases to activity diagrams using Visual Paradigm’s AI tools.
- 🚀 Generate Activity Diagrams from Use Cases Instantly 🚀: Step-by-step tutorial on instant activity diagram generation from use case descriptions.
- Visual Paradigm Desktop: AI Activity Diagram Generation: Release notes and features for AI-powered activity diagram generation in Visual Paradigm Desktop.
- Enhanced AI Activity Diagram Support in Visual Paradigm AI Chatbot: Updates on enhanced AI capabilities for activity diagram creation through conversational interface.
- UML Activity Diagram: A Definitive Guide to Visualizing Workflows with AI: Complete guide to creating activity diagrams using AI assistance.
- UML State Machine Diagram: A Definitive Guide to Modeling Object Behavior with AI: Comprehensive guide to state machine diagram creation with AI support.
- Enhanced AI State Machine Diagram Generation: Latest enhancements in AI-powered state machine diagram generation features.
- AI State Diagram Generator | Visual Paradigm AI: Official documentation for the AI state diagram generator tool.
- AI Diagram Generators – Visual Paradigm Ecosystem: Overview of all AI diagram generation tools available in the Visual Paradigm ecosystem.
- Import AI-Generated Activity Diagrams to Visual Paradigm Desktop: Guide on importing AI-generated diagrams from online tools to desktop application.
- Click Start AI – Visual Paradigm Technical Support: Getting started guide for Visual Paradigm’s AI features.
- Guide to Powered UML Diagram Generation: Vietnamese language guide to AI-powered UML diagram generation.
- Visual Paradigm AI Chatbot – UML State Machine Diagram: Interactive chatbot interface for creating state machine diagrams.
- Video Tutorials
- Visual Paradigm AI Features Tutorial: Video demonstration of AI-powered diagram generation features.
- Visual Paradigm AI Ecosystem Overview: Comprehensive video overview of Visual Paradigm’s AI ecosystem and capabilities.
Turn every software project into a successful one with Visual Paradigm’s AI-powered modeling tools!