Welcome to the world of Unified Modeling Language (UML)! Whether you’re a student, a developer, or someone interested in understanding
Continue reading
Learning one new thing everyday


Welcome to the world of Unified Modeling Language (UML)! Whether you’re a student, a developer, or someone interested in understanding
Continue readingUnified Modeling Language (UML) is a powerful tool used to visualize, specify, construct, and document the artifacts of software-intensive systems.
Continue reading
Unified Modeling Language (UML) is a powerful tool for visualizing and designing complex systems. Whether you’re a seasoned developer or
Continue reading
Unified Modeling Language (UML) is a standardized modeling language used to visualize the design of a system. It provides a
Continue reading
Introduction A deployment diagram in the Unified Modeling Language (UML) is a type of structure diagram that shows the physical
Continue reading
This guide provides a detailed overview of the Webstore system architecture as depicted in the diagram. The system is divided
Continue reading
Introduction A UML (Unified Modeling Language) profile is a mechanism for extending UML to create domain-specific extensions. Profiles allow you
Continue reading
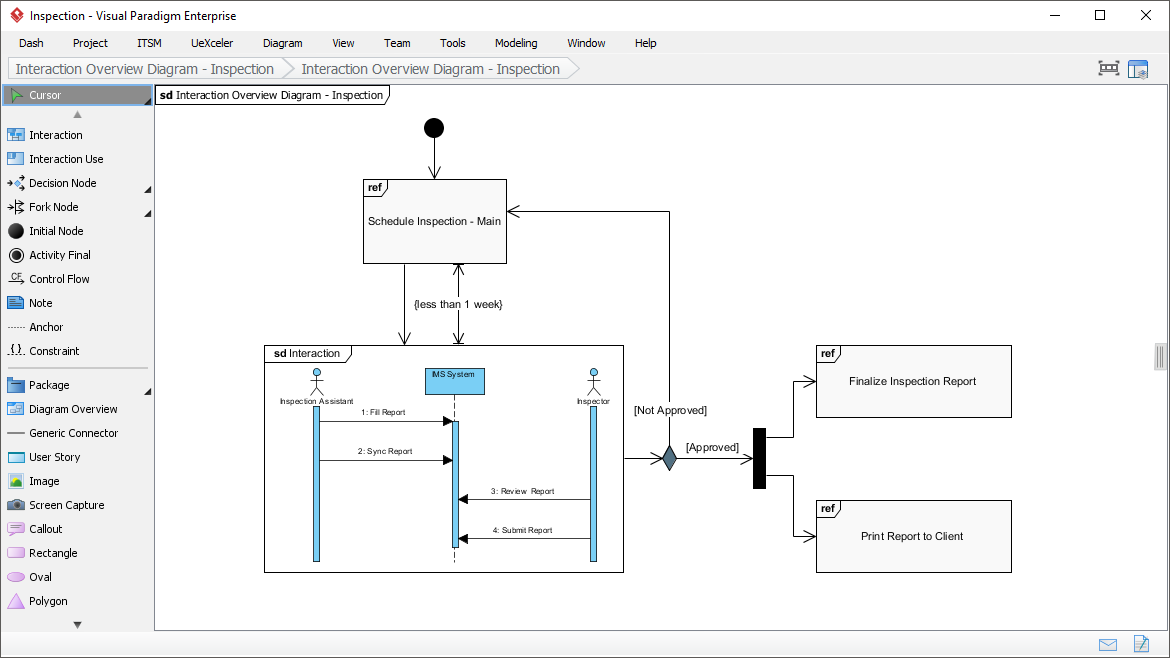
Introduction An Interaction Overview Diagram (IOD) is a type of diagram in the Unified Modeling Language (UML) that provides a
Continue reading
Overview The Timing Diagram illustrates the sequence and timing of various activities involved in an inspection process. It helps in
Continue reading
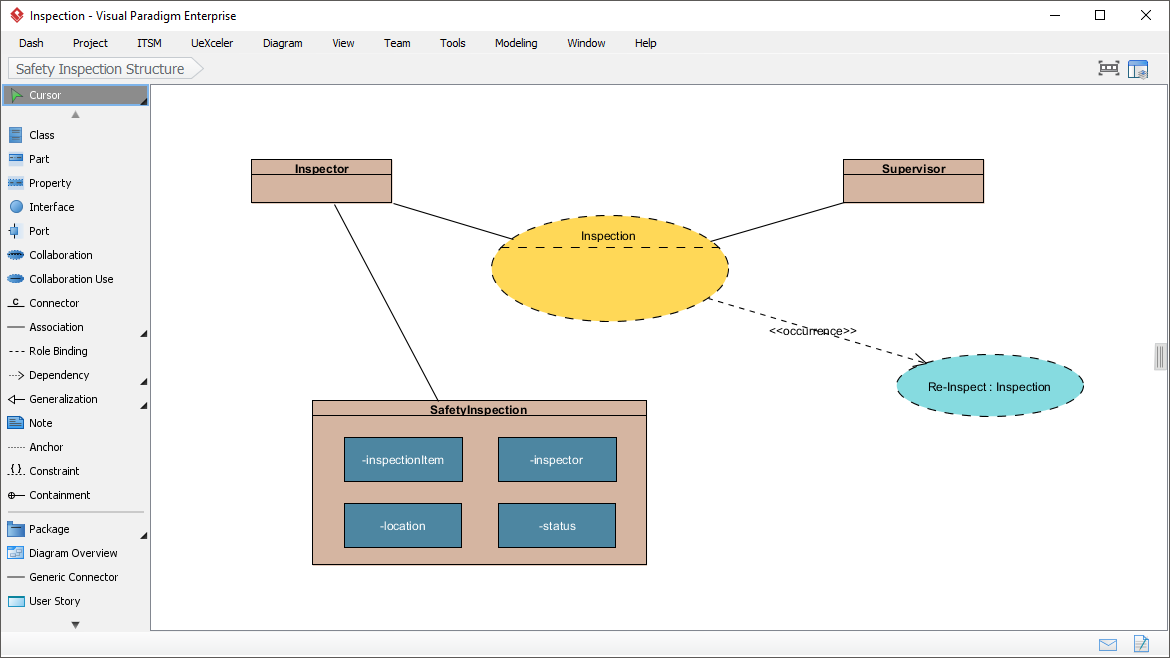
Introduction A Composite Structure Diagram (CSD) is a type of diagram in the Unified Modeling Language (UML) that provides a
Continue reading