
Introduction
In today’s rapidly evolving software development landscape, clear communication and precise system design are more critical than ever. Unified Modeling Language (UML) has emerged as the industry-standard visual modeling language that bridges the gap between complex system requirements and implementable solutions. Whether you’re a seasoned architect, a developer, or a business stakeholder, UML provides a universal language to visualize, specify, construct, and document software systems.

What makes UML particularly powerful is its versatility—it’s not just for software systems. From manufacturing processes to business workflows, UML helps teams across industries create blueprints that everyone can understand. In this comprehensive guide, we’ll explore all 14 UML diagram types, share real-world examples, and demonstrate how AI-powered tools like Visual Paradigm are revolutionizing the way we create and maintain these essential diagrams.

What is UML?
UML is a general-purpose modeling language created by the Object Management Group (OMG). Since its first specification draft in January 1997, UML has become the de facto standard for visualizing complex systems. While it’s rooted in object-oriented concepts, its applications extend far beyond traditional software development.
Key Characteristics:
-
General-Purpose Modeling: UML isn’t limited to software—it models any complex system, from business processes to manufacturing workflows
-
Visual Language: “A picture is worth a thousand words” perfectly captures UML’s value in communicating complex ideas
-
Object-Oriented Foundation: Built on OO principles, focusing on identifying objects, assigning responsibilities, and modeling relationships
-
Multi-Perspective View: Captures architectural, behavioral, and structural aspects from different stakeholder viewpoints
-
Not a Programming Language: While UML itself isn’t code, modern tools can generate executable code in various languages from UML diagrams
Real-World User Experience
“When I first started using UML in my enterprise project, I was skeptical about the overhead. But after creating our first use case diagram, the entire team finally had a shared understanding of what we were building. It eliminated weeks of miscommunication.” — Senior Software Architect, Fortune 500 Company
The Purpose and Goals of UML
Before UML, object-oriented development lacked standardization. Different teams used different notations, making collaboration difficult. UML solved this by providing:
Primary Goals:
-
Universal Modeling Language: A simple, standardized language that all modelers can use regardless of their background
-
Accessibility: Designed for developers, business users, analysts, and stakeholders—not just technical experts
-
Versatility: Applicable to both software and non-software systems
-
Process Enhancement: UML complements development methodologies rather than replacing them
Bottom Line: UML provides a simple yet powerful mechanism to model practically any system in today’s complex environment.
Modeling Architecture Views: The 4+1 View Model
Different stakeholders see systems differently. A developer cares about code structure, while a business analyst focuses on functionality. UML addresses this through the 4+1 Views of Software Architecture, which provides multiple perspectives of the same system.
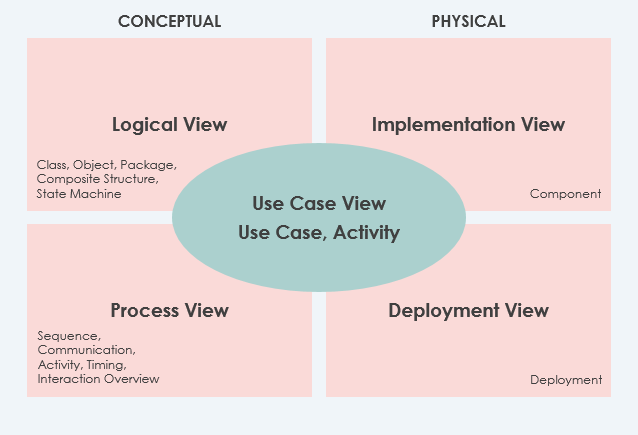
The Five Views:
1. Use Case View (The Center)
-
Purpose: Describes system functionality, external interfaces, and principal users
-
Contains: Use-Case Model
-
Status: Mandatory – All architecture elements derive from requirements
-
Who Uses It: Business analysts, stakeholders, end users
2. Logical View
-
Purpose: Shows system structure in terms of implementation units
-
Elements: Packages, classes, interfaces, and their relationships
-
Status: Mandatory
-
Who Uses It: Developers, architects
3. Implementation View
-
Purpose: Organizes development artifacts in the file system
-
Elements: Files, directories, configuration items
-
Status: Optional
-
Who Uses It: Development teams, DevOps engineers
4. Process View
-
Purpose: Describes run-time system structure and behavior
-
Elements: Processes, threads, EJBs, servlets, DLLs, data stores, queues
-
Status: Optional
-
Focus: Performance, reliability, and other run-time quality attributes
-
Who Uses It: System engineers, performance analysts
5. Deployment View
-
Purpose: Maps the system to hardware infrastructure
-
Status: Optional
-
Who Uses It: System administrators, infrastructure teams
Bonus: Data View
-
A specialization of the logical view for systems where persistence is critical
-
Used when design-to-data model translation isn’t automated
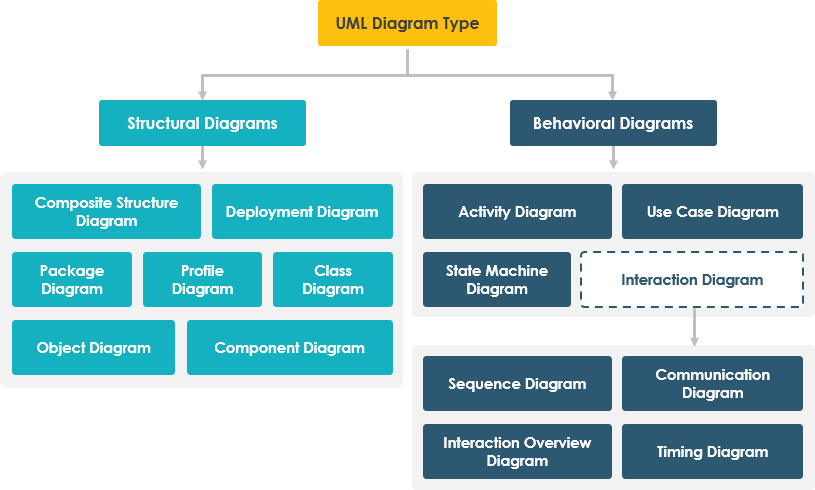
The 14 Types of UML 2 Diagrams
UML diagrams are the heart of the modeling language, categorized into two main groups:
-
Structural Diagrams (7 types): Show static structure
-
Behavioral Diagrams (7 types): Show dynamic behavior over time
STRUCTURAL DIAGRAMS
1. Class Diagram
What It Is: The most popular UML diagram, class diagrams describe objects in a system and their relationships. They represent the static view and can be directly mapped to object-oriented programming languages.
Key Elements:
-
Classes with attributes and operations
-
Relationships (associations, inheritance, dependencies)
-
Multiplicity constraints
When to Use:
-
Designing object-oriented systems
-
Database schema design
-
Code documentation
User Experience:
“Class diagrams saved our team during a major refactoring. We could visualize all the dependencies before making changes, preventing countless bugs.”
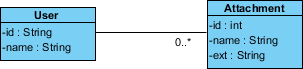
Class Diagram Example
The following example shows a User class that can upload multiple Attachments:
Benefits:
-
✅ Direct mapping to code (Java, C++, Python, etc.)
-
✅ Clear visualization of system structure
-
✅ Identifies design flaws early
-
✅ Facilitates team communication
2. Object Diagram
What It Is: An instance of a class diagram showing a snapshot of the system at a specific moment in time. While class diagrams show abstract models, object diagrams show concrete instances.
Key Elements:
-
Objects (instances of classes)
-
Links (instances of associations)
-
Attribute values at a specific time
When to Use:
-
Validating class diagrams
-
Showing example data structures
-
Debugging complex object relationships
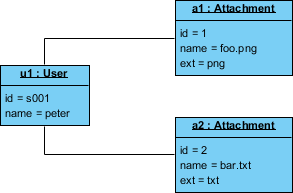
Object Diagram Example
This example shows the moment when user “Peter” is uploading two attachments:
Benefits:
-
✅ Validates class diagram designs
-
✅ Provides concrete examples for stakeholders
-
✅ Helps identify edge cases
-
⚠️ Limited use case—primarily for examples and validation
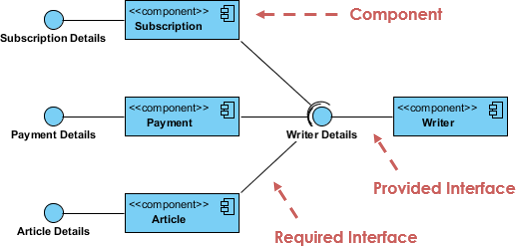
3. Component Diagram
What It Is: Describes the static implementation view of a system, showing physical components like libraries, files, and folders.
Key Elements:
-
Components (physical modules)
-
Interfaces (provided and required)
-
Dependencies between components
When to Use:
-
Planning system implementation
-
Managing code libraries
-
Reverse engineering existing systems
Component Diagram Example
Benefits:
-
✅ Clear implementation roadmap
-
✅ Supports forward and reverse engineering
-
✅ Manages complex system dependencies
-
✅ Facilitates component reuse
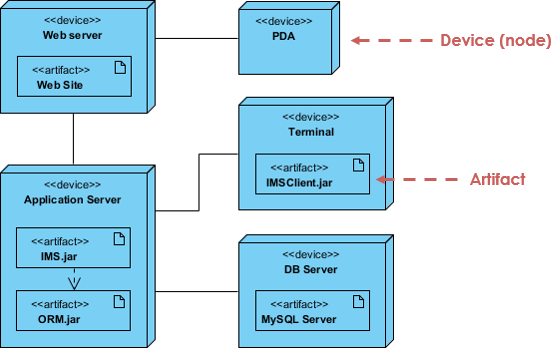
4. Deployment Diagram
What It Is: Shows the physical deployment of artifacts on hardware nodes. Essential for system engineers and infrastructure planning.
Key Elements:
-
Nodes (hardware devices)
-
Artifacts (software components)
-
Communication paths
When to Use:
-
Infrastructure planning
-
System deployment documentation
-
Network architecture design
Deployment Diagram Example
Benefits:
-
✅ Visualizes hardware-software mapping
-
✅ Identifies infrastructure requirements
-
✅ Plans system scalability
-
✅ Documents deployment topology
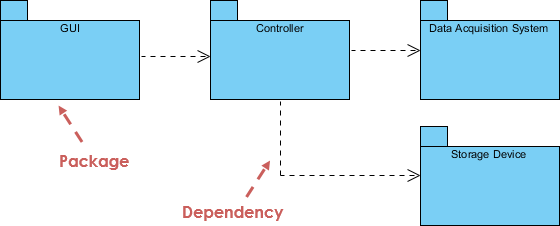
5. Package Diagram
What It Is: Organizes model elements into packages and shows dependencies between them. Perfect for managing large, multi-layered systems.
Key Elements:
-
Packages (logical groupings)
-
Dependencies
-
Import/merge relationships
When to Use:
-
Organizing large models
-
Managing multi-tier applications
-
Defining module boundaries
Package Diagram Example
Benefits:
-
✅ Manages complexity through grouping
-
✅ Clarifies module dependencies
-
✅ Supports team organization
-
✅ Enables parallel development
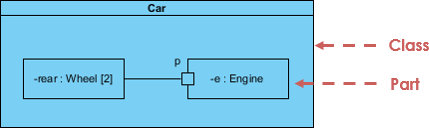
6. Composite Structure Diagram
What It Is: A UML 2.0 addition showing the internal structure of classes and their collaborations at a micro level.
Key Elements:
-
Internal parts
-
Ports (interaction points)
-
Connectors between parts
When to Use:
-
Modeling complex class internals
-
Designing component collaborations
-
Detailed architectural views
Composite Structure Diagram Example
Benefits:
-
✅ Reveals internal class structure
-
✅ Shows runtime collaborations
-
✅ Defines clear part roles
-
✅ Models complex component interactions
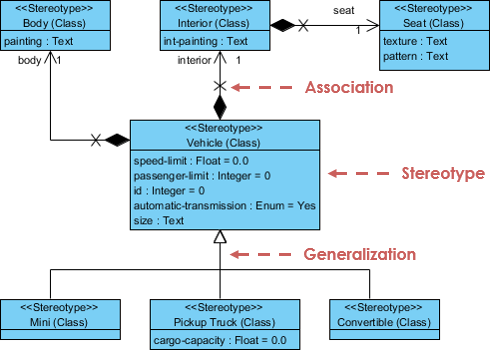
7. Profile Diagram
What It Is: Enables creation of domain-specific and platform-specific stereotypes, extending UML for specialized needs.
Key Elements:
-
Stereotypes (custom extensions)
-
Tagged values
-
Constraints
When to Use:
-
Creating domain-specific languages
-
Extending UML for specific platforms
-
Enforcing modeling standards
Profile Diagram Example
Benefits:
-
✅ Customizes UML for specific domains
-
✅ Enforces organizational standards
-
✅ Creates reusable modeling extensions
-
✅ Supports platform-specific modeling
BEHAVIORAL DIAGRAMS
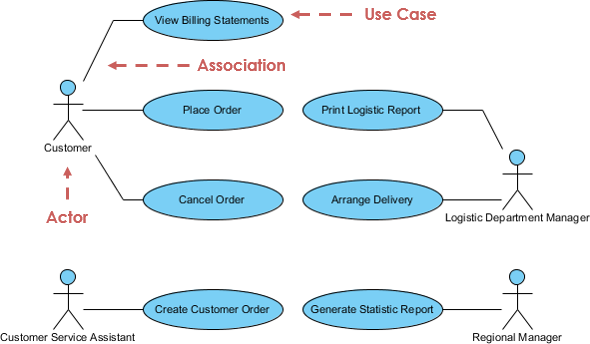
8. Use Case Diagram
What It Is: Captures system functional requirements from a user’s perspective, showing what the system does rather than how it does it.
Key Elements:
-
Actors (users or external systems)
-
Use cases (system functionalities)
-
Relationships (associations, includes, extends)
When to Use:
-
Requirements gathering
-
High-level system design
-
Stakeholder communication
Use Case Diagram Example
Benefits:
-
✅ Captures user requirements clearly
-
✅ Excellent planning instrument
-
✅ Used across all development phases
-
✅ Bridges business and technical teams
-
⚠️ Not ideal for code generation
User Experience:
“Our use case diagrams became the single source of truth for what we’re building. Product owners, developers, and testers all reference them daily.”
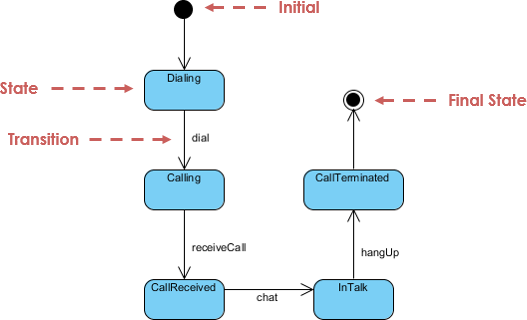
9. State Machine Diagram
What It Is: Models the lifecycle of an object, showing states, transitions, and events. Also known as statechart or state transition diagrams.
Key Elements:
-
States (conditions of an object)
-
Transitions (state changes)
-
Events (triggers for transitions)
-
Actions (activities during transitions)
When to Use:
-
Modeling object lifecycle
-
Designing reactive systems
-
Documenting workflow states
State Machine Diagram Example
Benefits:
-
✅ Models complete object lifecycle
-
✅ Identifies all possible states
-
✅ Prevents invalid state transitions
-
✅ Supports forward and reverse engineering
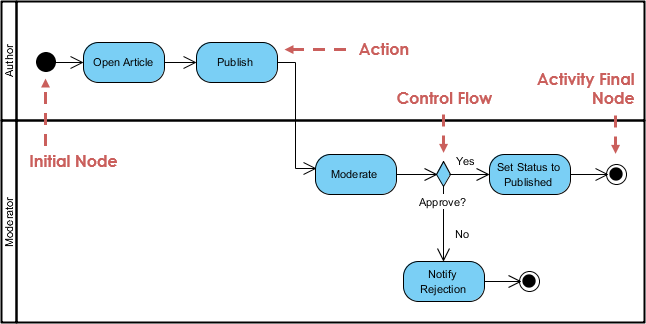
10. Activity Diagram
What It Is: Models workflows and business processes, showing the flow of control from one activity to another.
Key Elements:
-
Activities (actions or operations)
-
Decision points (branches)
-
Parallel flows (concurrent activities)
-
Start and end points
When to Use:
-
Business process modeling
-
Workflow documentation
-
Algorithm visualization
-
Organizational process design
Activity Diagram Example
Benefits:
-
✅ Models both computational and organizational processes
-
✅ Shows parallel and concurrent flows
-
✅ High-level business requirement modeling
-
✅ Clear workflow visualization
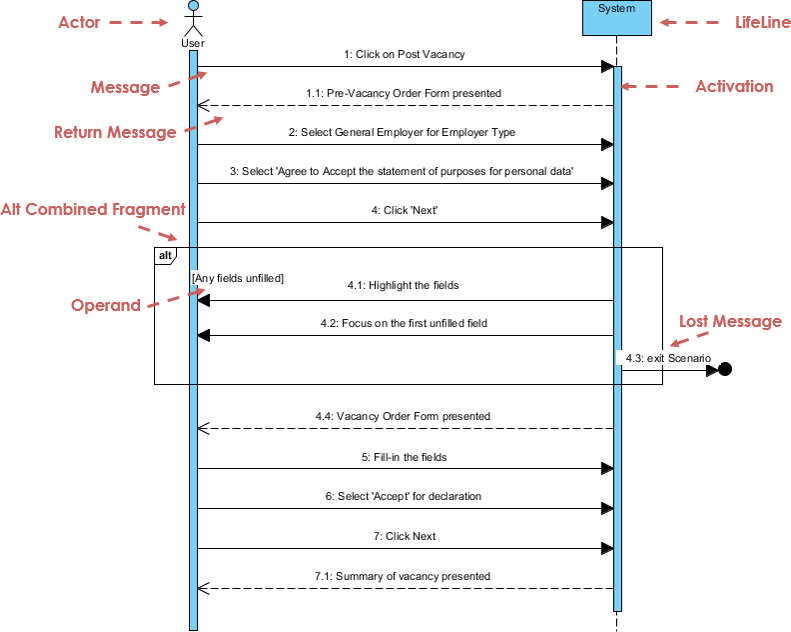
11. Sequence Diagram
What It Is: Models object interactions based on time sequence, showing how objects collaborate in a specific scenario.
Key Elements:
-
Lifelines (participating objects)
-
Messages (communications between objects)
-
Time sequence (top to bottom)
-
Activation bars (execution periods)
When to Use:
-
Detailed design of use cases
-
Understanding object interactions
-
API design and documentation
Sequence Diagram Example
Benefits:
-
✅ Clear time-based interaction modeling
-
✅ Identifies missing objects or methods
-
✅ Documents API call sequences
-
✅ Can be generated from use case descriptions (AI-powered)
AI Enhancement: Modern tools like Visual Paradigm can generate sequence diagrams directly from use case descriptions, saving hours of manual work.
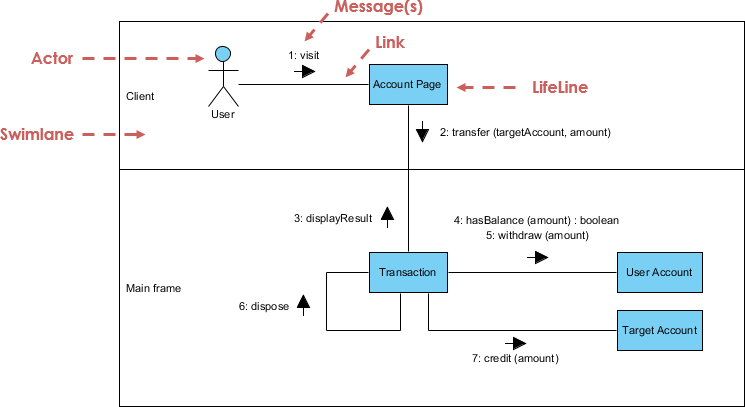
12. Communication Diagram
What It Is: Similar to sequence diagrams but focuses on object collaboration rather than time sequence. Shows the structural organization of objects and their relationships.
Key Elements:
-
Objects and their roles
-
Messages with sequence numbers
-
Links between objects
When to Use:
-
Understanding object relationships
-
Simplifying complex interactions
-
Alternative view to sequence diagrams
Communication Diagram Example
Benefits:
-
✅ Emphasizes object collaboration
-
✅ Simpler for complex interactions
-
✅ Semantically equivalent to sequence diagrams
-
✅ Easy conversion between diagram types
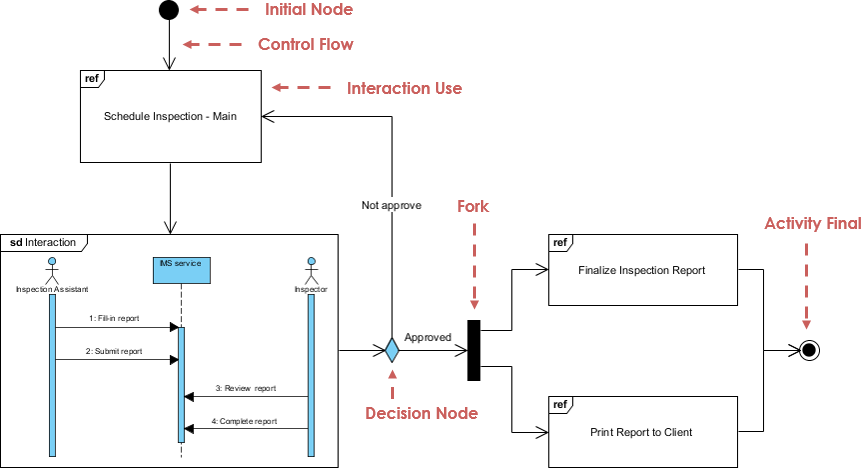
13. Interaction Overview Diagram
What It Is: A hybrid diagram combining features of activity and sequence diagrams. Provides a high-level overview of control flow between interactions.
Key Elements:
-
Interaction occurrences
-
Control flow nodes
-
Hidden message details
When to Use:
-
High-level interaction overview
-
Linking multiple detailed diagrams
-
Complex system navigation
Interaction Overview Diagram Example
Benefits:
-
✅ High-level interaction overview
-
✅ Links detailed diagrams together
-
✅ Hides complexity when not needed
-
✅ Achieves high navigability between diagrams
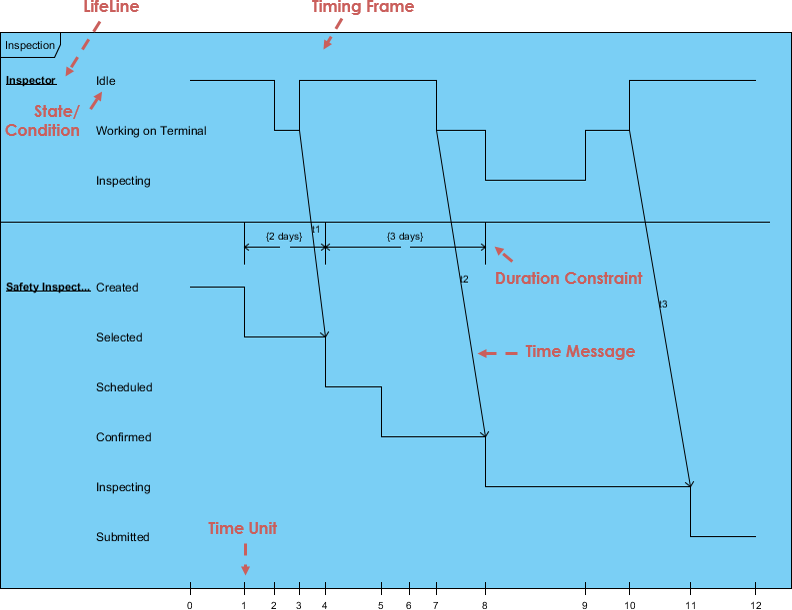
14. Timing Diagram
What It Is: Shows object behavior over a specific time period, with time progressing from left to right. A specialized form of sequence diagram.
Key Elements:
-
Lifelines in vertical compartments
-
Time axis (left to right)
-
State changes over time
-
Timing constraints
When to Use:
-
Real-time system design
-
Performance analysis
-
Hardware-software interaction
-
Time-critical systems
Timing Diagram Example
Benefits:
-
✅ Precise timing analysis
-
✅ Visualizes time constraints
-
✅ Essential for real-time systems
-
✅ Shows state duration clearly
Transform Your UML Practice with AI-Powered Tools
Creating professional UML diagrams traditionally requires significant time and expertise. However, AI-powered tools are revolutionizing this process, making diagram creation faster, more accurate, and accessible to everyone.
🤖 AI Diagram Chatbot
Instant Diagram Drafting Through Natural Conversation
Stop struggling with diagram syntax. Simply describe what you want to model in plain English, and watch as AI generates professional diagrams instantly.
Perfect For:
-
Quickly capturing use case views
-
Prototyping system behaviors
-
Brainstorming sessions
-
Non-technical stakeholders
👉 Try it now: AI Diagram Chatbot
User Experience:
“I described my e-commerce checkout process in three sentences, and the chatbot generated a complete activity diagram. What used to take 30 minutes now takes 30 seconds.”
🌐 AI WebApps
Step-by-Step AI-Guided Workflows
Transform simple sketches into detailed architecture with AI guidance. These web-based tools walk you through the entire modeling process.
Features:
-
Guided workflows from concept to implementation
-
Evolve your architecture incrementally
-
Cloud-based collaboration
-
No installation required
👉 Start creating: AI WebApps
Benefits:
-
✅ Reduces learning curve for beginners
-
✅ Ensures best practices
-
✅ Maintains consistency across diagrams
-
✅ Accelerates development cycles
⚡ AI Diagram Generator
Professional UML Diagrams Within Visual Paradigm Desktop
Generate fully-compliant UML diagrams directly in your desktop environment. The AI understands context and applies OMG standards automatically.
Capabilities:
-
Generate diagrams from text descriptions
-
Auto-complete missing relationships
-
Suggest improvements and optimizations
-
Ensure OMG standard compliance
👉 Learn more: AI Diagram Generator Guide
Real-World Impact:
“Our team reduced diagram creation time by 70%. The AI catches design flaws we would have missed and suggests better patterns automatically.”
📝 OpenDocs
Modern Knowledge Management with Live Diagrams
Centralize your documentation and embed AI-generated diagrams that stay synchronized with your models.
Features:
-
Live diagram embedding
-
Automatic updates
-
Collaborative documentation
-
Version control integration
👉 Explore: OpenDocs
Benefits:
-
✅ Single source of truth
-
✅ Always up-to-date documentation
-
✅ Bridges documentation and design
-
✅ Improves knowledge sharing
🚀 The Complete AI Diagramming Ecosystem
Ready to modernize your entire modeling process? Visual Paradigm’s integrated AI ecosystem provides end-to-end support from initial concept to final deployment.
Explore the full ecosystem: Best AI Diagram Generator – Visual Paradigm Ecosystem
Why UML Matters Today
For Developers:
-
Clearer Code Structure: Well-designed class diagrams lead to cleaner, more maintainable code
-
Faster Onboarding: New team members understand the system architecture quickly
-
Better Communication: Visual diagrams transcend language barriers in global teams
For Architects:
-
System Validation: Identify design flaws before writing a single line of code
-
Stakeholder Alignment: Ensure everyone understands the system vision
-
Documentation: Create living documentation that evolves with the system
For Business Stakeholders:
-
Requirement Clarity: Use case diagrams ensure we’re building the right thing
-
Risk Reduction: Visual models expose gaps and misunderstandings early
-
Investment Protection: Clear architecture reduces costly rework
For Project Managers:
-
Progress Tracking: Diagrams provide concrete milestones
-
Resource Planning: Component and deployment diagrams inform staffing needs
-
Risk Management: Identify dependencies and integration challenges upfront
Best Practices for UML Modeling
1. Start Simple
Don’t try to model everything at once. Begin with use case diagrams to capture requirements, then progressively add detail.
2. Choose the Right Diagram
-
Requirements phase → Use Case Diagrams
-
Design phase → Class, Sequence, State Machine Diagrams
-
Implementation → Component, Deployment Diagrams
-
Business processes → Activity Diagrams
3. Keep It Current
Outdated diagrams are worse than no diagrams. Use AI tools to maintain synchronization between code and diagrams.
4. Involve Stakeholders
Different diagrams serve different audiences. Show business stakeholders use cases, show developers class diagrams.
5. Leverage AI
Modern AI tools eliminate the tedium of diagram creation, letting you focus on design quality rather than syntax.
6. Iterate and Refine
Your first diagram won’t be perfect. Refine as you learn more about the system requirements.
Common Pitfalls to Avoid
❌ Over-Modeling: Don’t create diagrams for everything. Focus on what adds value.
❌ Under-Modeling: Conversely, skipping diagrams for complex systems leads to confusion.
❌ Inconsistent Notation: Stick to UML standards. Custom notations confuse team members.
❌ Ignoring Maintenance: Diagrams must evolve with the system or become liabilities.
❌ Tool Lock-in: Use standard UML to ensure portability between tools.
Summary
UML has proven itself as an indispensable tool for modern software development and system design. Its strength lies in:
✅ Universality: Non-proprietary, open standard adopted worldwide
✅ Versatility: Applicable to software and non-software systems
✅ Comprehensiveness: 14 diagram types cover every modeling need
✅ Community Support: Backed by methodologists, organizations, and tool vendors
✅ Evolution: Continuously improved based on industry feedback
The Two Faces of “Unified”
-
Standardization: UML ended the fragmentation of modeling languages, replacing Booch, OMT, OOSE, and others with a single, coherent standard
-
Integration: UML unifies perspectives across:
-
Different system types (business vs. software)
-
Development phases (requirements, design, implementation)
-
Stakeholder viewpoints (developers, users, managers)
-
Conclusion
Unified Modeling Language has evolved from a niche notation to the universal language of system design. Whether you’re architecting enterprise software, optimizing manufacturing processes, or designing complex workflows, UML provides the visual vocabulary to communicate ideas clearly and precisely.
The 14 diagram types we’ve explored—from class diagrams that map directly to code, to use case diagrams that capture business requirements, to timing diagrams that model real-time behavior—offer a comprehensive toolkit for any modeling challenge. Each serves a specific purpose, and mastering when to use which diagram is a skill that separates good architects from great ones.
But perhaps the most exciting development in UML modeling is the integration of artificial intelligence. Tools like Visual Paradigm’s AI-powered ecosystem are democratizing diagram creation, making professional-grade modeling accessible to everyone. What once required hours of manual work and deep UML expertise can now be accomplished in minutes through natural conversation with AI.
The future of system design isn’t about choosing between human creativity and AI efficiency—it’s about combining them. Let AI handle the tedious syntax and standard compliance while you focus on what matters: designing elegant, robust systems that solve real problems.
Whether you’re just starting your UML journey or looking to modernize your existing practice, the combination of proven modeling principles and cutting-edge AI tools puts unprecedented power at your fingertips. The question isn’t whether to adopt UML, but how quickly you can integrate these tools into your workflow.
Start modeling smarter today. Your future self—and your team—will thank you.
References
- AI-Powered Visual Modeling and Design Solutions: This resource highlights AI-driven tools for visual modeling and diagramming that accelerate software development workflows.
- AI Textual Analysis – Transform Text into Visual Models Automatically: AI identifies system elements from unstructured descriptions to automatically generate UML diagrams, such as class and use case models.
- AI-Powered UML Class Diagram Generator: This tool utilizes AI-assisted automation to generate accurate UML class diagrams directly from natural language input.
- Mastering UML Activity Diagrams with AI: This article explores how AI features enhance the creation and optimization of UML activity diagrams for developers and analysts.
- Visual Paradigm – AI-Powered UML Sequence Diagrams: This resource explains how to generate professional UML sequence diagrams instantly using AI within a modeling suite.
- AI-Powered Use Case to Activity Diagram Tutorial: A step-by-step guide demonstrating how to automatically convert use case descriptions into detailed activity diagrams using AI automation.
- The Future of Modeling: AI and UML Diagram Generation: This analysis discusses how artificial intelligence is transforming UML diagram creation by streamlining complex modeling tasks.
- AI-Powered Component Diagrams with Visual Paradigm Chatbot: This article details how the AI chatbot simplifies component diagram creation by transforming natural language into precise models.
- UML Package Diagram: Structuring Your Codebase with AI: A guide on using AI to aid in structuring systems, managing dependencies, and maintaining scalable software architecture through UML package diagrams.
- How AI Chatbot Can Help You Learn UML Faster: This blog post explains how AI assistants support interactive UML learning by providing real-time feedback and visualizing concepts instantly.
- AI Diagram Chatbot: Instant diagram drafting through natural conversation for quickly capturing use case views and system behaviors.
- AI WebApps: Step-by-step AI-guided workflows to create and evolve architecture from simple sketches to detailed implementation views.
- AI Diagram Generator Guide: Generate professional UML diagrams directly within Visual Paradigm Desktop with full OMG standards compliance.
- OpenDocs: Modern knowledge management system to centralize documents and embed live AI-generated diagrams.
- Visual Paradigm AI Diagramming Ecosystem: Complete overview of AI-powered diagramming tools and ecosystem integration.