
Introduction: My “Aha!” Moment with Business Process Modeling
As someone who’s spent years wrestling with complex business process documentation, I’ll be honest: the first time I encountered an Event-Driven Process Chain (EPC) diagram, my brain felt like it had hit a firewall. The hexagons, the functions, the logical operators—it all looked like hieroglyphics from a parallel universe where project managers speak fluent alien.
But here’s the thing that changed everything for me: I stopped trying to memorize symbols and started focusing on what problem I was actually trying to solve. Once I understood that EPC diagrams are simply a visual language for mapping “when this happens, then that happens,” everything clicked. And when I discovered Visual Paradigm’s AI-powered diagramming tools? Game changer.
")
This isn’t a textbook tutorial. This is my real-world experience—warts, wins, and workflow breakthroughs included—of learning EPC modeling and leveraging modern AI tools to make the process actually enjoyable. If you’ve ever stared at a blank canvas wondering where to start, you’re in the right place.
What Is an Event-Driven Process Chain (EPC)? My Simplified Take
When I first read the textbook definition—”a flow chart for business process modeling introduced by August-Wilhelm Scheer in the early 1990s”—my eyes glazed over. Let me translate that into human terms:
An EPC diagram is like a storyboard for your business workflow. It answers three simple questions:
-
What triggers this process? (Events)
-
What actions happen next? (Functions)
-
How do decisions and parallel tasks flow? (Operators)
The beauty? It uses intuitive graphical symbols so even non-technical stakeholders can follow along. No more endless meetings where everyone interprets the same process differently.
My Cheat Sheet: EPC Symbols Decoded (With Real Examples)
Here’s how I finally made sense of the building blocks—tested during an actual order fulfillment process mapping session:
| Name | Representation | Description | My Practical Tip |
|---|---|---|---|
| Event | 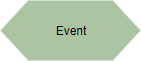 |
Describes circumstances that trigger or result from a function | Start every process with “Order Received” and end with “Order Shipped”—bookends keep you grounded |
| Function |  |
Describes transformations from one state to another | Use action verbs: “Validate Payment,” “Generate Invoice”—if it doesn’t do something, it’s probably an event |
| Operator |  |
AND: activate all paths concurrently OR: activate one or more paths XOR: choose one path |
XOR is your “if-then” decision point. I color-code these in red during brainstorming—prevents logic loops |
| Organization unit | 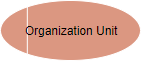 |
Shows who’s responsible for a function | Link functions to actual team names (“Finance Team,” not just “Department”)—makes accountability crystal clear |
| Control flow |  |
Connects events with functions, creating logical sequence | Draw these LAST. Get the logic right first, then connect the dots |
| Process path | 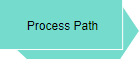 |
Shows connections to other processes | Use these for subprocesses like “Payment Processing”—keeps main diagram clean |
| Organization unit assignment |  |
Links org units to functions they own | Essential for RACI matrices later—don’t skip this step |
| Information resource |  |
Real-world objects providing input/output data | Label these clearly: “Customer Database,” “Inventory System”—prevents “where does this data come from?” meetings |
| System |  |
Provider of functions in a process | Distinguish between manual tasks and automated system functions—critical for automation planning |
| Information flow |  |
Shows data movement between functions | Arrow direction matters! Data flows into functions that read it, out of functions that write it |
The Game-Changer: Creating EPC Diagrams with Visual Paradigm’s AI Tools
My “Wait, This Actually Works?” Moment
I’ll admit—I was skeptical about AI diagramming tools. “How can an algorithm understand my messy business logic?” But after watching a colleague generate a clean EPC draft in under 2 minutes using Visual Paradigm’s AI features, I had to try it myself.
Here’s my step-by-step walkthrough of the process that transformed my workflow:
Step 1: Access the AI Tool (Two Paths, Same Destination)
Desktop Route (Professional Edition):
-
Open Visual Paradigm Desktop
-
Navigate to Tool → AI Diagram
-
Select your diagram type
Online Route (No Installation Needed):
-
Go to Visual Paradigm Online
-
Click “Create with AI” in your workspace
-
Choose your diagram type
Pro tip from my experience: Start with the online version for quick prototypes. Switch to desktop when you need advanced collaboration features.
Step 2: Choose Your Diagram Type Wisely
While Visual Paradigm doesn’t have a button labeled “EDP Diagram” (Entity Data Processing), you have two powerful alternatives that achieve the same goals:
✅ Data Flow Diagram (DFD): Best for modeling how data moves through processing steps
✅ Entity Relationship Diagram (ERD): Best for modeling what data entities exist and how they relate
My rule of thumb: If your process is about “what happens to the data,” use DFD. If it’s about “what data do we store and connect,” use ERD.
Step 3: Describe Your System in Plain English (This Is Where Magic Happens)
This is the part that blew my mind. Instead of dragging symbols manually, I typed:
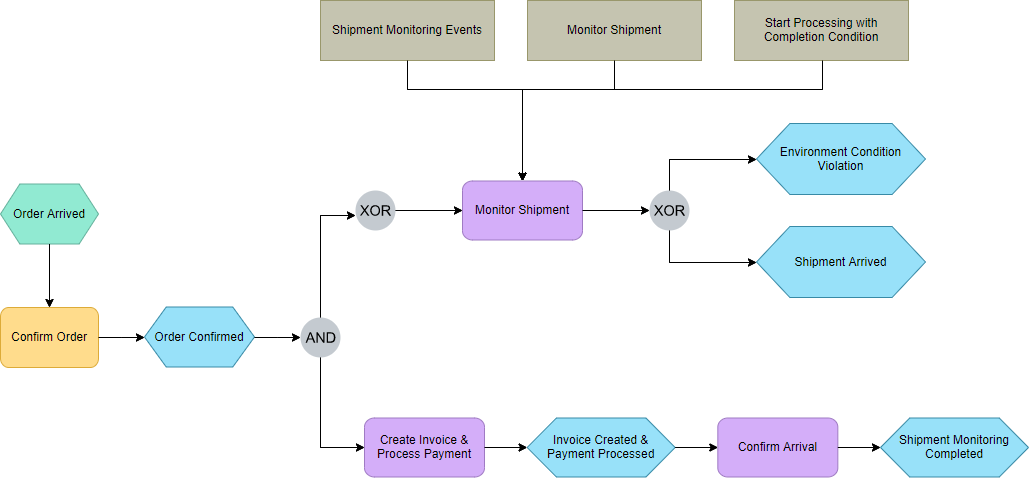
“An e-commerce order process: Customer places order → System validates inventory → If in stock, reserve items and process payment → If payment succeeds, generate shipping label and notify warehouse → If payment fails, notify customer and release inventory”
Within seconds, the AI generated this:
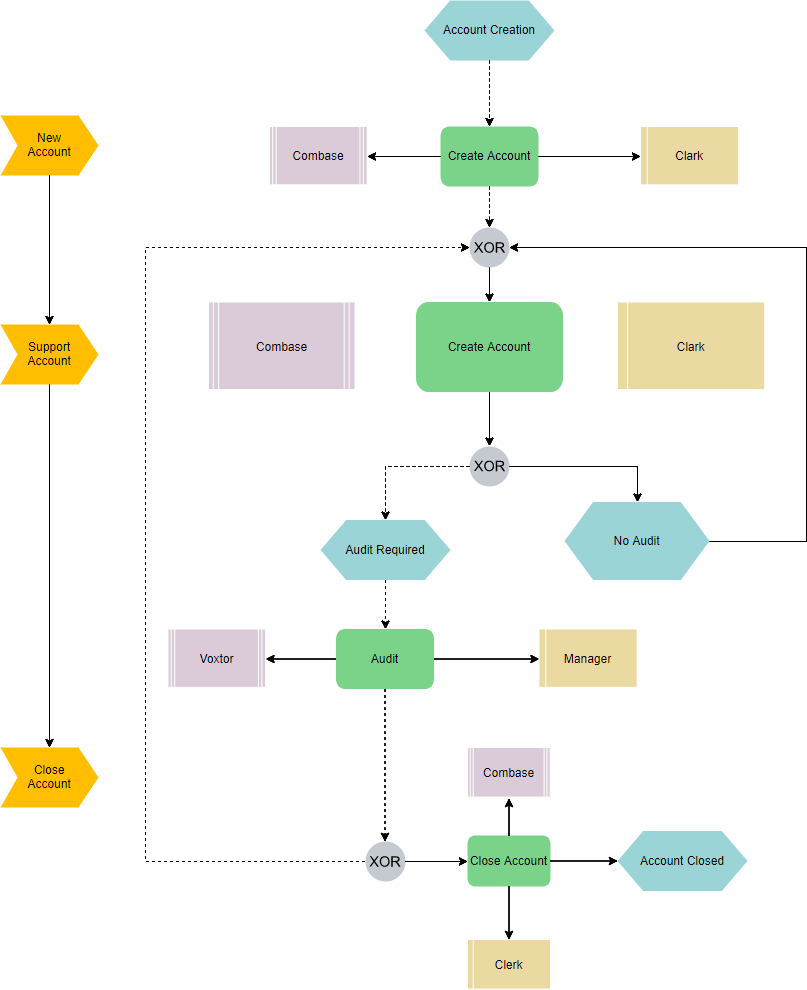
Edit this Event-Driven Process Chain Diagram
What impressed me: The AI correctly identified XOR decision points (in stock? payment success?) and AND parallel paths (generate label AND notify warehouse). It even suggested appropriate event labels I hadn’t considered.
Step 4: Refine Through Conversation (Yes, Really)
Instead of manual editing, I treated the AI like a collaborative partner:
Me: "Add a database for transaction logs"
AI: *Adds "Transaction Log DB" entity with appropriate relationships*

Me: "Connect the payment gateway to the fraud detection system"
AI: *Creates information flow with correct directionality*

Me: "Make the inventory check happen before payment processing"
AI: *Reorders functions and updates control flows automatically*
This conversational editing saved me hours of manual repositioning. The AI understands context—when I said “payment gateway,” it knew I meant the external system component, not just a generic function.
Step 5: Import and Polish for Final Delivery
Once the AI draft looked solid, I clicked “Import to Visual Paradigm” to bring it into my main project. Here’s where manual refinement still matters:
-
Adjust layout for presentation clarity
-
Add company-specific styling (colors, fonts)
-
Insert UML notes for technical specifications
-
Link to external documentation
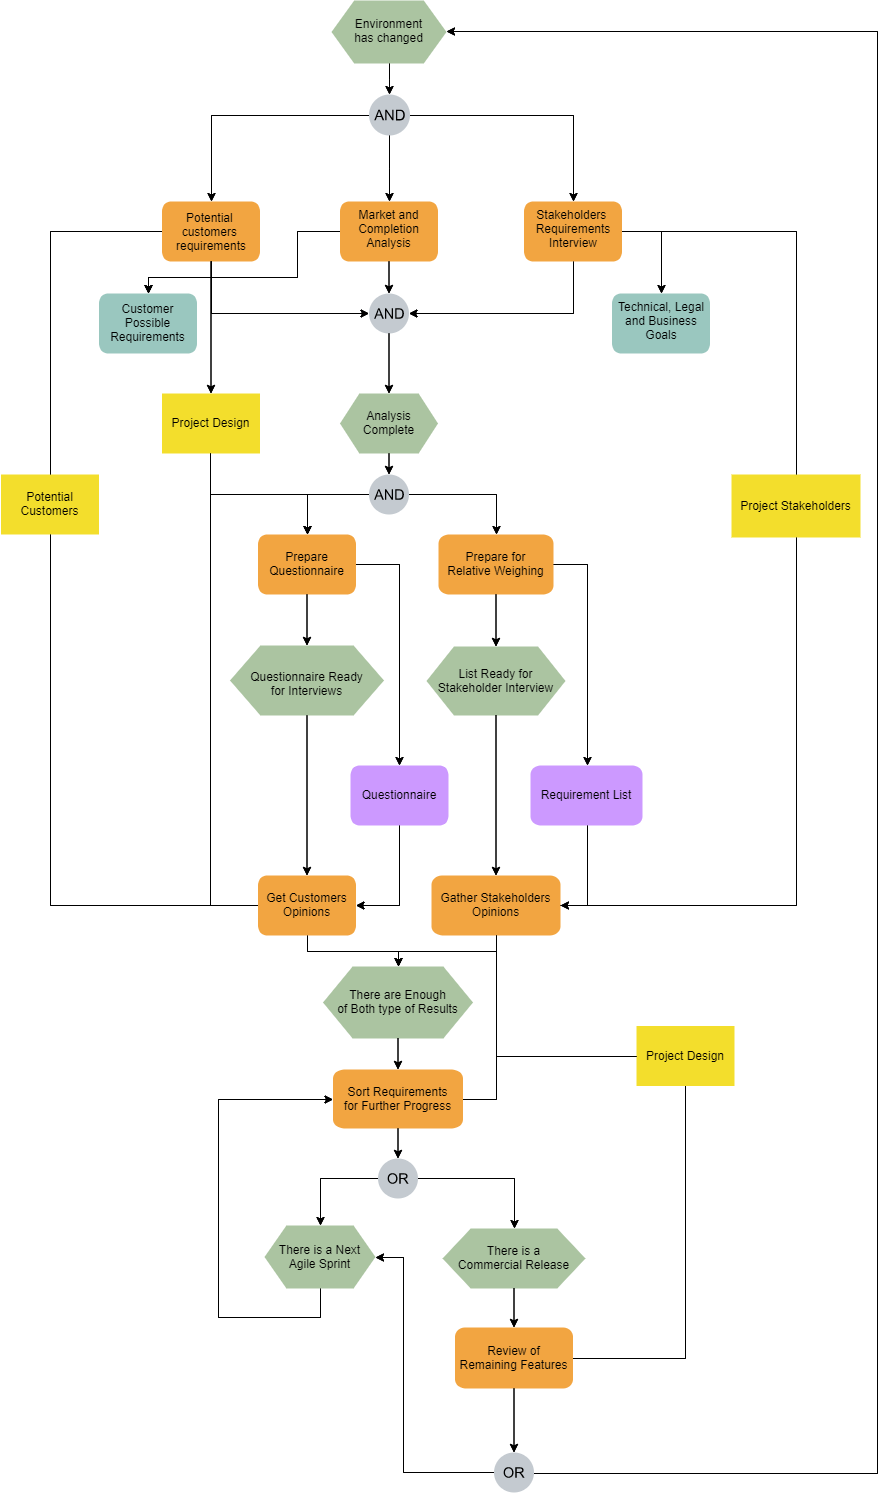
Edit this Event-Driven Process Chain
My workflow hack: I keep two versions—the AI-generated “logic draft” for stakeholder review, and the polished “presentation version” for executive meetings.
Key AI Features That Actually Made My Life Easier (No Hype, Just Results)
✨ Text-to-Diagram: From Napkin Sketch to Professional Diagram in Minutes
I used to spend half a day translating whiteboard sessions into clean diagrams. Now I type my bullet points, and the AI handles symbol placement, connector routing, and label formatting. The output is standards-compliant from the start—no more “does this arrow mean what I think it means?” confusion.
💬 Conversational Editing: Your AI Co-Pilot for Diagram Refinement
This feature alone justified my subscription. Instead of hunting through menus to add a new entity, I just type: “Add a customer notification step after payment confirmation.” The AI interprets intent, suggests appropriate symbols, and positions them logically. It’s like having a junior analyst who never gets tired.
🎨 Intelligent Layout: Because Nobody Likes Manual Alignment
Remember spending 20 minutes nudging boxes to align perfectly? The AI’s layout engine automatically handles spacing, connector routing, and hierarchical grouping. I still tweak for aesthetic preferences, but the heavy lifting is done.
🔍 Quality Checks: Catching My Mistakes Before Stakeholders Do
The AI flags common modeling issues:
-
“This XOR decision has no default path”
-
“Function ‘Process Order’ has no input event”
-
“Circular dependency detected between A and B”
These aren’t just warnings—they come with suggested fixes. I’ve caught three critical logic errors this way that would have caused major rework later.
My Honest Verdict: When to Use AI Diagramming (and When to Stick with Manual)
✅ AI Tools Shine When:
-
You’re brainstorming initial process flows
-
You need to rapidly prototype multiple scenarios
-
You’re onboarding new team members (visual learning accelerates understanding)
-
You’re documenting legacy processes from verbal descriptions
-
You need to generate stakeholder-ready drafts quickly
⚠️ Manual Refinement Still Matters When:
-
You’re implementing strict enterprise architecture standards
-
You need pixel-perfect alignment for printed documentation
-
You’re working with highly regulated processes requiring audit trails
-
You’re customizing symbols beyond standard libraries
-
You’re collaborating with stakeholders who prefer hands-on diagram editing
My balanced approach: Use AI for 80% of the heavy lifting, then manually refine the final 20% for precision and polish. This hybrid workflow cut my diagram creation time by 60% while improving accuracy.
Conclusion: Why This Changed How I Approach Process Modeling
Looking back, my biggest breakthrough wasn’t mastering EPC symbols or learning Visual Paradigm’s interface. It was shifting my mindset from “I need to draw the perfect diagram” to “I need to communicate the right logic clearly.”
The AI tools didn’t replace my expertise—they amplified it. Instead of wrestling with software mechanics, I could focus on what matters: understanding business processes, identifying bottlenecks, and designing better workflows. The diagrams became a byproduct of clear thinking, not the end goal itself.
If you’re hesitant about AI-assisted diagramming, I get it. I was too. But after using these tools across three major process mapping projects, I can confidently say: the time saved, the errors prevented, and the collaboration enabled are worth the learning curve.
Start small. Try describing one simple process in plain English. Let the AI generate a draft. Tweak it conversationally. Import it. Polish it. Then ask yourself: “Could I have done this faster or clearer without the AI?”
My answer, after dozens of diagrams: not a chance.
Your workflow clarity is waiting. Go generate it.
References
- Comprehensive Review: Visual Paradigm’s AI Diagram Generation Features: An in-depth user review exploring practical applications, strengths, and limitations of Visual Paradigm’s AI-powered diagramming capabilities across multiple use cases.
- Visual Paradigm’s AI Diagram Generator Expands: Instant Creation of DFDs, ERDs, Mind Maps and More: A detailed feature analysis highlighting the expansion of AI diagram generation to support multiple diagram types with practical implementation examples.
- AI Diagram Generation | Visual Paradigm Features: Official feature documentation describing text-to-diagram conversion, conversational editing, and intelligent layout capabilities with use case demonstrations.
- Guide to Powered UML Diagram Generation | Visual Paradigm AI Chatbot: Step-by-step tutorial for leveraging the AI chatbot interface to generate and refine UML diagrams through natural language commands.
- Visual Paradigm AI Diagram Generation Tutorial: Video walkthrough demonstrating the end-to-end process of creating professional diagrams using AI assistance, including prompt engineering tips and refinement techniques.
- Advanced AI Diagramming Techniques in Visual Paradigm: Expert-level video guide covering complex scenario modeling, multi-diagram coordination, and integration with version control systems.
- From Concept to Code: The Ultimate Guide to Visual Paradigm’s AI-Enhanced ERD Tools: Comprehensive resource connecting AI-generated entity relationship diagrams to actual database implementation workflows.
- Powered UML Diagram Generation Guide | Visual Paradigm AI: Interactive guide for using conversational AI to iteratively build and refine UML models with real-time feedback.
- Import AI Activity Diagram to Visual Paradigm Desktop: Release notes and tutorial for seamlessly transferring AI-generated activity diagrams from online tools to desktop environments for advanced editing.
- AI Diagram Generator Release Notes: Official documentation of feature updates, performance improvements, and new capabilities in Visual Paradigm’s AI diagram generation engine.