


What is a Data Flow Diagram?
A data flow diagram is a graphical representation of the flow of data in an information system. It can describe incoming data flows, outgoing data flows, and stored data. DFD does not mention how data flows through the system.
The DFD technique decomposes the high-level data flow diagram into a set of more detailed diagrams, providing an overall view of the complete system, as well as more detailed decomposition. Provides an overall view of the complete system, as well as a more detailed decomposition and, where appropriate, a more detailed breakdown and description of individual activities to facilitate clarification and understanding.
As a result, the scope and boundaries of the system are clearly indicated in the diagram. The end result of a well-developed DFD is a “big picture” that shows what is happening at each level.
Why DFD?
Data-flow diagrams provide a graphical representation of the system that aims to be accessible to
computer specialist and non-specialist users alike. It is a graphical representation that is very easy to understand as it helps to visualize the content.
The models enable software engineers, customers and users to work together effectively during the analysis and specification of requirements.
Although this means that our customers are required to understand the modeling techniques and constructs, in data-flow modeling only a limited set of constructs are used, and the rules applied are designed to be simple and easy to follow.
Here are the benefits of DFD technique:
- It is a straightforward graphical technique that is easy to understand.
- It can be more easily understood by technical and non-technical audiences.
- It helps to describe the boundaries of the system.
- It facilitates the communication of existing system knowledge to the end-users.
- It provide a detailed representation of the system components.
- It is used as part of the system documentation.
DFD vs Flowchart
There is a significant difference between a DFD and a flowchart. Basically, DFDs show the flow of data; flow charts show the flow of control.
- A flowchart describes the flow of control in a program module and helps illustrate the steps to solve a problem.
- A DFD illustrates the inputs, outputs, how data will flow through the system and where the data will be stored. It does not contain any control or branching elements.
Elements of DFD
- Entities – Entities are the source and destination of information data. Entities are represented by
rectangles and have their own names.
- Processes – Activities and actions performed on the data are represented by circular or circular rectangles.
- Data Storage – There are two variants of data storage – it can be represented as – 1. It can be represented as a rectangle without two small edges, 2) or as an open rectangle with only one edge
An open rectangle with missing edges.
- Data flow – the movement of data is represented by sharp arrows. The movement of the data is shown as going from the bottom of the arrow as its source to the head of the arrow as its destination.
Data Flow Example – e-Banking
A bank manager provides the new account details to the open Account process, which results in the customer details being held in the Customer database datastore and the account details being held in the Account database datastore. Although we use the word “result” in our interpretation, DFD does not imply causation; All it shows is that the account opening process can read data from the bank manager’s interface without writing data to the customer database and account database data stores in a particular order.
A customer using the online banking login process must provide some data, such as a user name and password, in the form of a set of login credentials.
A customer may receive a sum of money from a withdrawal or contribute a sum of money to a deposit; In both cases, this results in an update of the account balance in the account database datastore (although this causality cannot be explicitly modeled).
A customer can initiate the funds transfer process and must provide the account destination and the amount of funds. The funds transfer process can send the amount of funds to another bank through another bank interface.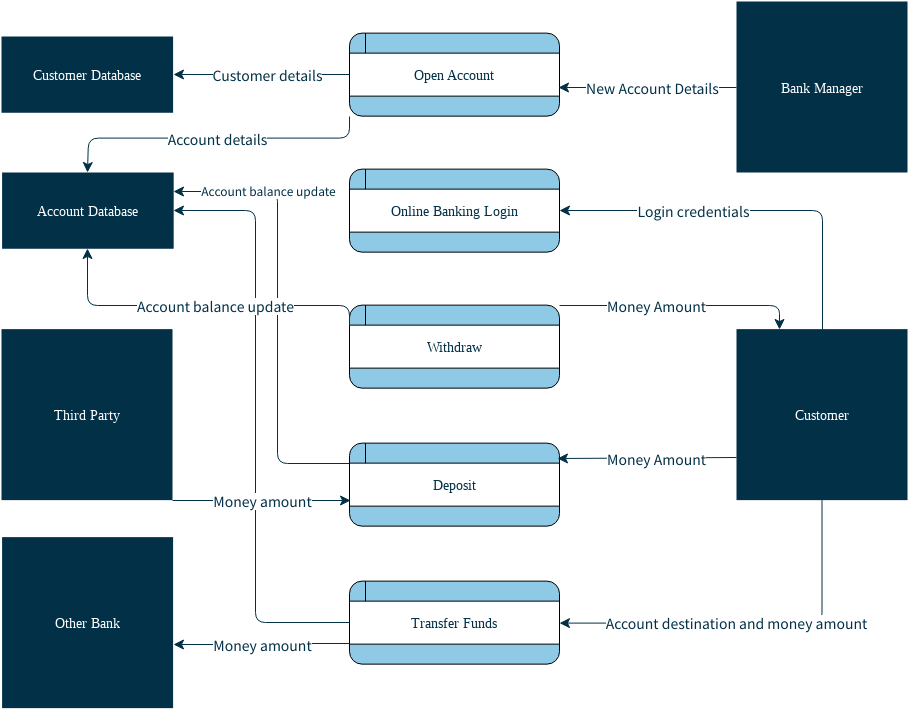
Edit this Data Flow Diagram example
This DFD example shown above includes five processes, four external interfaces/roles, and two data stores. It is not meant to be an exhaustive representation of data flows in a banking system, but it is comprehensive enough to give a sense of how to build a DFD.
Top-Down Decomposition Technique – Multiple level DFDs
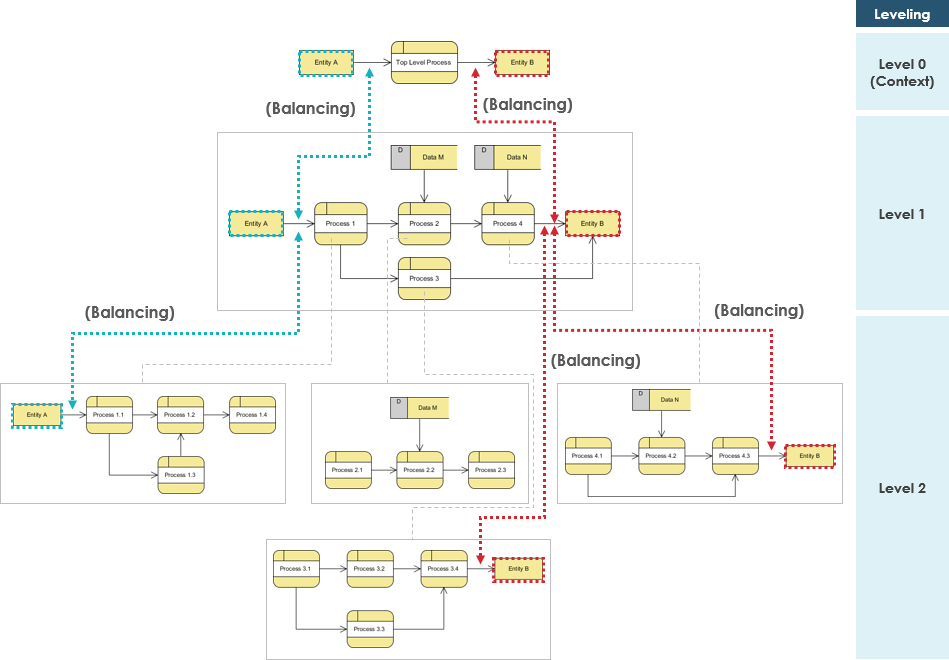
A major advantage of the data-flow modelling technique is that, through a technique called top-down decomposition (also known as “levelling”), the detailed complexity of real world systems can be managed and modeled in a hierarchy of abstractions. Levelling is accomplished by drawing a series of increasingly detailed DFDs until the desired level of detail is reached.
To make DFDs even more overly complex (i.e., not too many processes), you can create multi-level DFDS.
- The context diagram contains the control (aggregated) system process.
- The higher-level DFD is less detailed (more detailed DFD is elaborated at the lower level) called top-down decomposition process.
- The context diagram starts with the process numbers (e.g., process 1, process 2, and so on).
- The numbering continues in the next so-called first level (DFD) . For example, process 1 in the context diagram is refined into the three processes in the level one DFD and is numbered 1.1, 1.2 and 1.3.
- Similarly, processes in the second layer are numbered, e.g. 2.1.1, 2.1.2, 2.1.3 and 2.1.4. The numbering for process in the hierarchy:
- (1, 2, 3,…);
- (1.1, 1.2, 1.3, …, 2.1, 2.2, 2.3,…);
- (1.1.1, 1.1.2, 1.1.3,…).
- The number of layers depends on the size of the model system.
When performing top-down decomposition to a DFD to lower level DFDs, the inputs and outputs must be conserved between levels of DFDs. For example, level n & n+1 must have the same inputs and outputs
DFD Example – food ordering system
Context Diagram (Level 0 – DFD)
A Context diagram shows an overview of the system and how it interacts with other parts of the “world”. A context diagram is a data flow diagram that shows only the top level, which is called level 0. At this level, there is only one visible process node that represents the functionality of a complete system, i.e. how it interacts with external entities. Some of the benefits of the context diagram are.
- Shows an overview of the boundaries of a system
- By its simple notation, it does not require technical knowledge to understand
- Easy to draw, modify and elaborate due to its limited notation
The figure below shows a context diagram (top-level data flow diagram) drawn for a food ordering system.
- It contains a process (shape) representing the system model, in this case the “food ordering system”.
- It also shows the participants that will interact with the system, called external entities.
In this example, the supplier, the kitchen, the manager and the customer are the entities that will interact with the system.
Between the process and the external entities, there are data flows (connectors) that show that there is an exchange of information between the entities and the system.
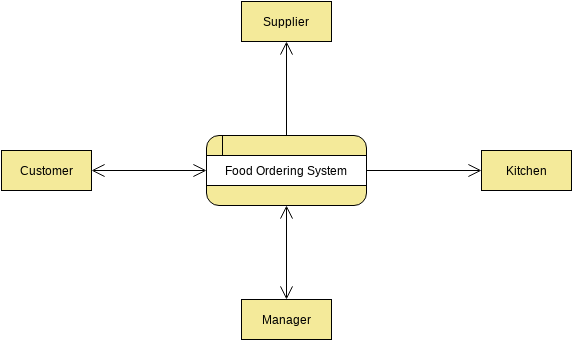
The Context DFD is the entry point to the data flow model. It contains one and only one process and does not show any data storage.
Level 1 DFD
The Level 1 DFD presents a more detailed view of the system than the context diagram. By showing the major sub-processes and data stores that make up the system.
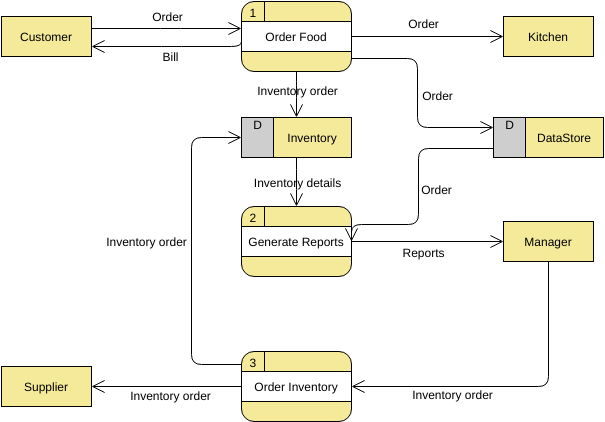
The following diagram shows the Level 1 DFD, which is a breakdown (i.e. decomposition) of the food ordering system processes shown in the Context DFD. Read through the diagram, and then we will introduce some key concepts based on it.
Edit this Data Flow Diagram example
An example of a food order system data flow diagram contains three processes, four external entities and two data stores.
- According to the diagram, we know that a customer can place an order. The food order process receives the order, forwards it to the kitchen, stores it in the order data store, and stores the updated inventory details in the inventory data store. The process also provides billing to the customer.
- Managers can receive reports through the Generate Report process, which takes inventory details and orders as inputs to the inventory and order data stores, respectively.
- The manager can also initiate the Order Inventory process by providing an inventory order. This process forwards the inventory order to the vendor and stores the updated inventory details in the inventory data store.
Logical vs Physical DFD
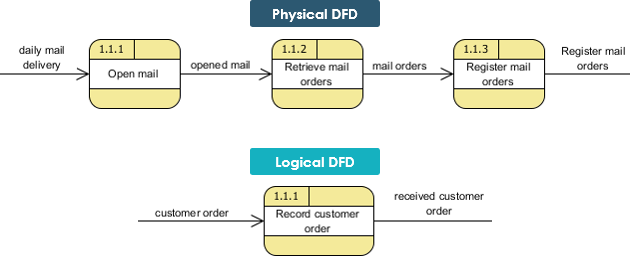
Data flow diagrams are divided into logical and physical data flow diagrams. The logical DFD focuses on the business and how it operates. It describes the business events that occur and the data required and generated for each event. A physical DFD, on the other hand, shows how the system will be implemented. The following are the main differences between a logical DFD and a physical DFD:
Logical DFD
- Logical DFD depicts how the business operates.
- The processes represent the business activities.
- The data stores represent the collection of data regardless of how the data are stored.
- It s how business controls.
Physical DFD
-
- Physical DFD depicts how the system will be implemented (or how the current system operates).
- The processes represent the programs, program modules, and manual procedures.
- The data stores represent the physical files and databases, manual files.
- It show controls for validating input data, for obtaining a record, for ensuring successful completion of a process, and for system security.
- Physical DFD specifies actual flow of physical documentation, while logical DFD only focus on the information flow in business term.
For example, Physical DFD specifies actual flow of physical documentation, while logical DFD only focus on the information flow in business term.
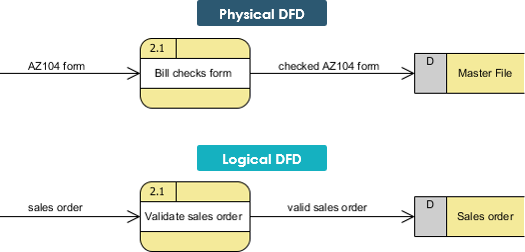
Furthermore, a logical DFD eliminates physical processes that refer to physical activities only and do not transform data.
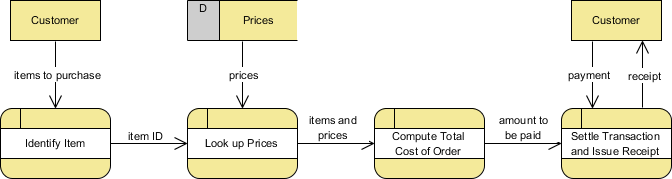
Logical DFD Example – Grocery Store
The logical DFD illustrates the processes involved without going into detail about the physical implementation of activities.
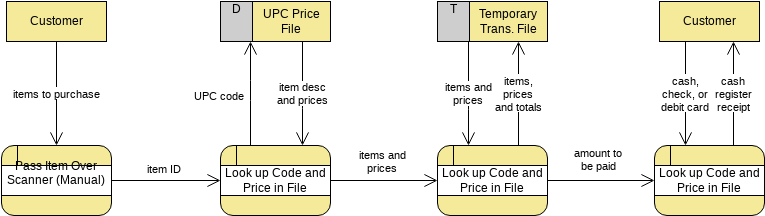
Physical DFD Example – Grocery Store
- The physical DFD shows that a bar code-the UPC PRICE code found on most grocery store items is used
- In addition, the physical DFD mentions manual processes such as scanning, explains that a temporary file is used to keep a subtotal of items
- The PAYMENT could be made by CASH, CHECK, or DEBIT CARD
Finally, it refers to the receipt by its name, CASH REGISTER RECEIPT
Edit this physical DFD example
Tips and Notes on Data Flow Diagrams
- Don’t make it too complicated; typically 5-7 average people can manage processes
- A data store must be associated with at least one process
- Data flow should not exist between 2 external entities without going through a process
- A process with an input but no output is considered a black hole process.
- Process labels should be verb phrases; datastores are represented by nouns.
- An external entity must be associated with at least one process
- DFDs are non-deterministic – numbering does not necessarily indicate order and is useful for identifying processes when discussing with users
- The data store should not be connected to an external entity, otherwise, it means you are giving an external entity direct access to your data file
Resources
- What is Data Flow Diagram (DFD)?
- How to Create Data Flow Diagram (DFD)?
- Data Flow Diagram (DFD) Software
- Data Flow Diagram Examples
This post is also available in Deutsch, Español, فارسی, Français, English, Bahasa Indonesia, 日本語, Polski, Portuguese, Ру́сский, Việt Nam, 简体中文 and 繁體中文.