


Introduction to UML: The Blueprint of Modern Software Design
Unified Modeling Language (UML) is a standardized, visual modeling language used to design, document, and communicate the architecture, behavior, and structure of software systems. Inspired by engineering blueprints, UML provides a universal vocabulary for developers, architects, business analysts, and stakeholders to collaborate effectively—regardless of technical background.
📌 UML is NOT a programming language.
It is a visual language for modeling systems—helping teams think through design before writing code.
Why UML Matters: The Need for Visual Clarity in Complex Systems
In today’s fast-paced software development landscape, complexity is inevitable. Teams span multiple disciplines—developers, testers, product managers, clients—and often work across time zones and platforms. Without a shared language, miscommunication leads to rework, delays, and poor-quality software.
Key Reasons Why UML is Essential:
- ✅ Cross-functional communication: Non-technical stakeholders (e.g., business owners, clients) understand system behavior without reading code.
- ✅ Early detection of flaws: Visualizing system structure and behavior early helps identify design issues before implementation.
- ✅ Agile alignment: UML supports iterative development by enabling quick modeling of new features and user stories.
- ✅ Documentation & knowledge transfer: UML diagrams serve as living documentation that evolves with the system.
💡 Example: A fintech startup launching a new payment gateway uses UML to align developers, compliance officers, and investors—ensuring everyone agrees on how transactions are processed, validated, and secured.
Types of UML Diagrams: Structural vs. Behavioral
UML diagrams are broadly categorized into two families:
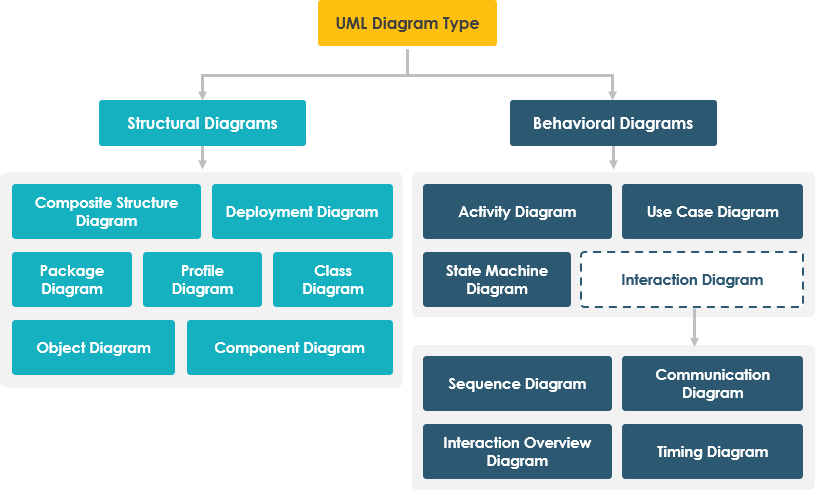
Let’s explore each in detail.
🔹 Structural UML Diagrams: The “Skeleton” of the System
These diagrams define the static architecture—what components exist and how they are related.
1. Class Diagram (The Foundation of OOP)
- Represents classes, their attributes, methods, and relationships (inheritance, association, aggregation, composition).
- Used during analysis and design phases.
- Best for: Defining system domain models and object relationships.
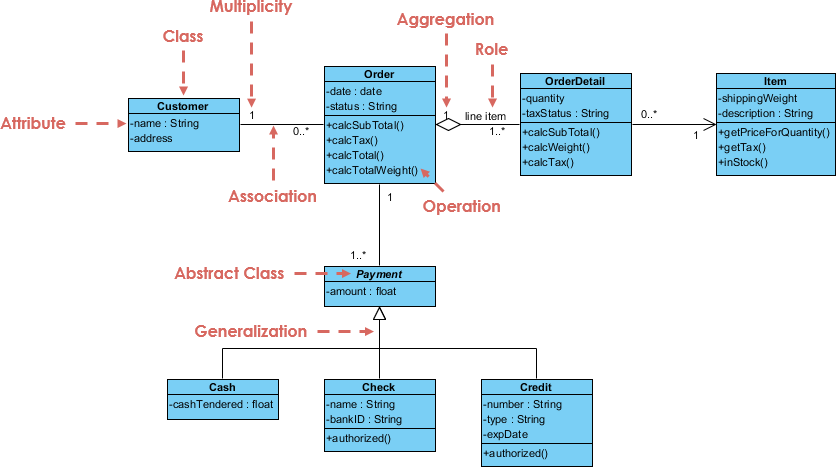
🧩 Example: In an e-commerce system,
Customer,Order, andProductclasses are defined with attributes likename,price, andorderDate.
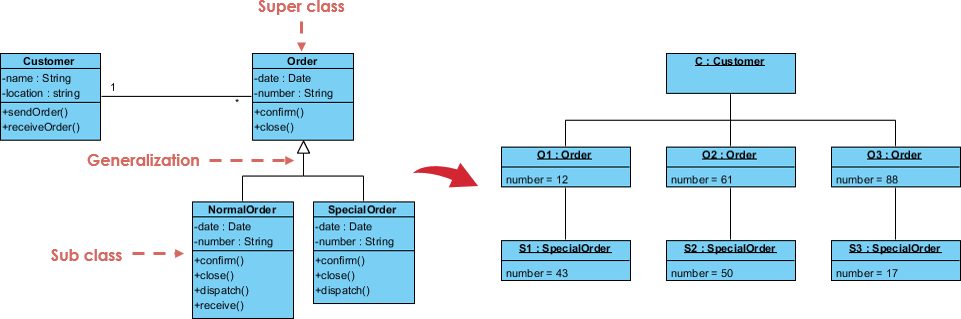
2. Object Diagram
- A snapshot of instances of classes at a specific point in time.
- Shows real-world data states (e.g., “Customer Alice placed Order #123”).
- Best for: Validating class models with concrete examples.
3. Component Diagram
- Illustrates how software components (modules, libraries, services) are organized and interact.
- Shows interfaces and dependencies.
- Best for: Microservices architecture, modular design, and API contracts.
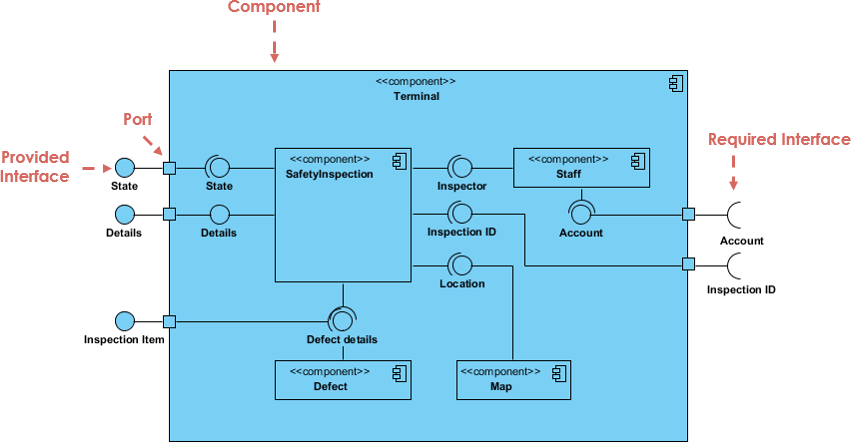
🛠️ Example: A banking app might have
Authentication Component,Payment Processing Component, andReporting Component, each communicating via well-defined interfaces.
4. Deployment Diagram
- Maps software artifacts to physical hardware (servers, devices, containers).
- Critical for cloud-native and distributed systems.
- Best for: DevOps planning, deployment strategy, and scalability modeling.
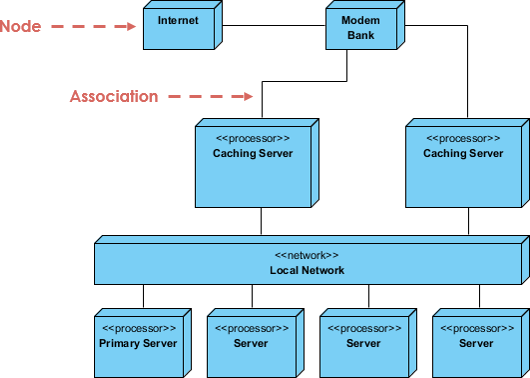
🌐 Example: A web application deployed across AWS EC2 instances, with Docker containers running backend services and a load balancer distributing traffic.
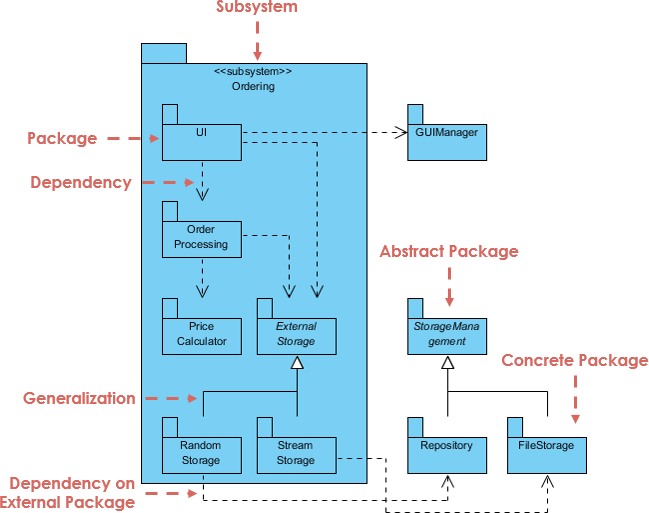
5. Package Diagram
- Groups related UML elements (classes, components, use cases) into logical packages.
- Helps manage complexity in large systems.
- Best for: Organizing large-scale projects and enforcing modular boundaries.
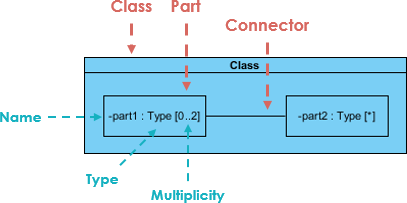
6. Composite Structure Diagram
- Shows internal structure of a class or component—how parts (ports, connectors) interact internally.
- Useful for complex systems where internal behavior matters (e.g., embedded systems).
- Best for: Designing internal logic of complex classes or components.
🔹 Behavioral UML Diagrams: The “Life” of the System
These diagrams model dynamic behavior—how the system responds to events over time.
1. Use Case Diagram
- Captures functional requirements from the user’s perspective.
- Actors (users or external systems) interact with use cases (functions).
- Best for: Requirements gathering, stakeholder alignment.
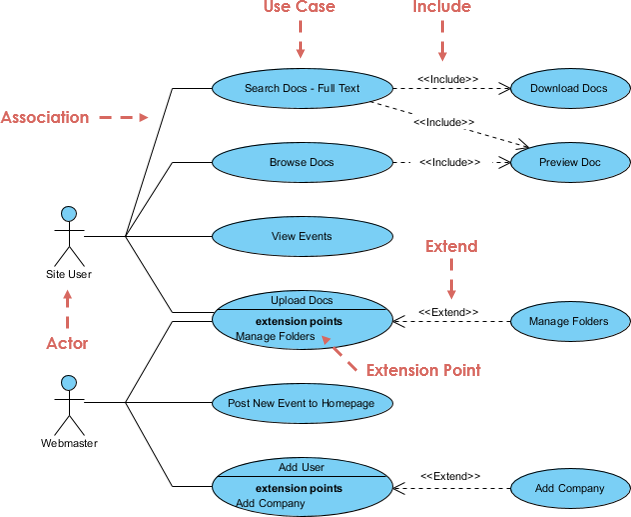
🎯 Example: In a hospital management system,
DoctorandPatientare actors;Schedule Appointment,Prescribe Medicationare use cases.
2. Sequence Diagram
- Shows the order of messages exchanged between objects over time.
- Ideal for detailing interactions in a specific scenario.
- Best for: Detailed design, debugging, and API specification.
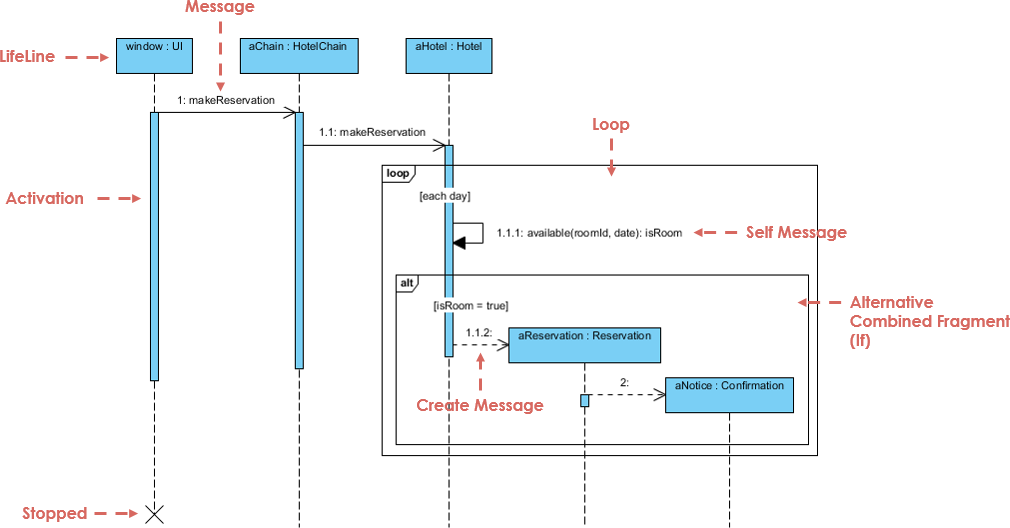
⏱️ Example: When a user logs in, the sequence goes:
Login UI → Auth Service → Database → Response.
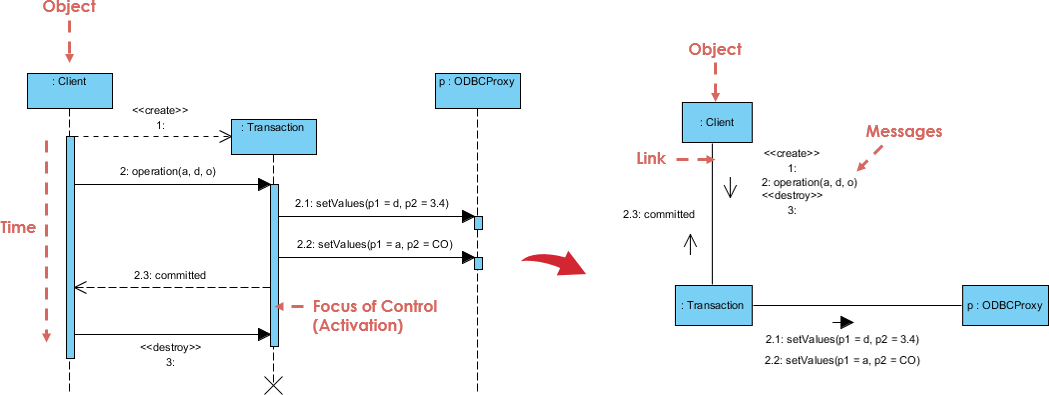
3. Communication Diagram (formerly Collaboration Diagram)
- Emphasizes object relationships and message flow.
- Less time-ordered than sequence diagrams but better at showing complex object networks.
- Best for: Understanding object collaboration in complex systems.
4. Activity Diagram
- Models workflows and business processes.
- Uses actions, decisions, forks/joins, and swimlanes.
- Best for: Business process modeling, workflow automation, and use case realization.
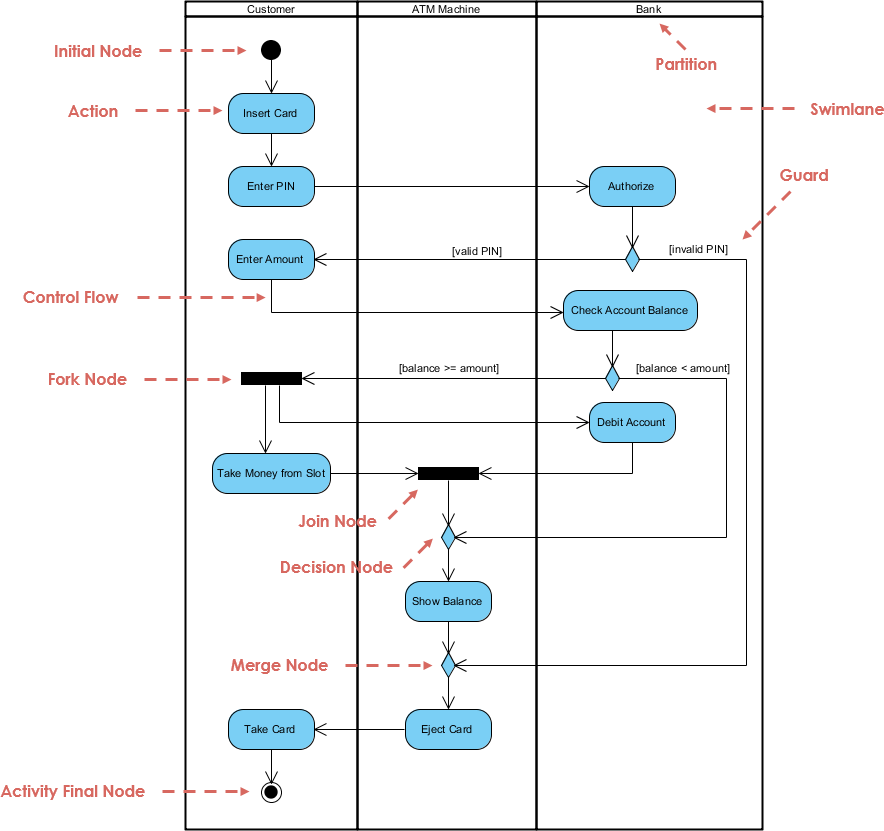
🔄 Example: A loan approval process with steps:
Application Received → Credit Check → Underwriting → Approval/Rejection.
5. State Machine Diagram
- Tracks how an object changes state in response to events.
- Uses states, transitions, and triggers.
- Best for: Modeling finite state logic (e.g., order status, user session, device state).
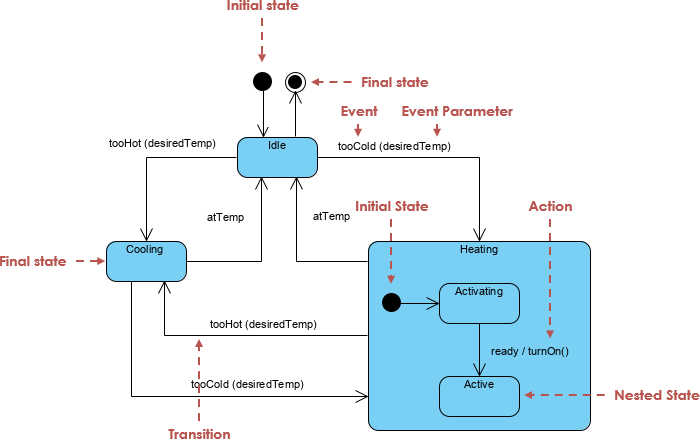
📊 Example: An order goes through states:
Pending → Processing → Shipped → Delivered → Cancelled.
6. Timing Diagram
- A specialized sequence diagram focused on time constraints.
- Shows how values change over time and when actions must occur.
- Best for: Real-time systems, embedded software, performance-critical applications.
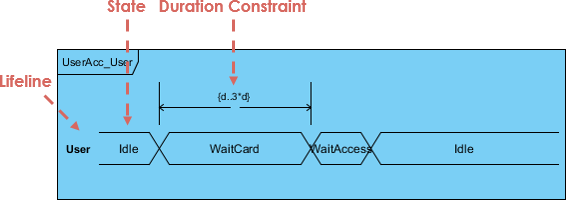
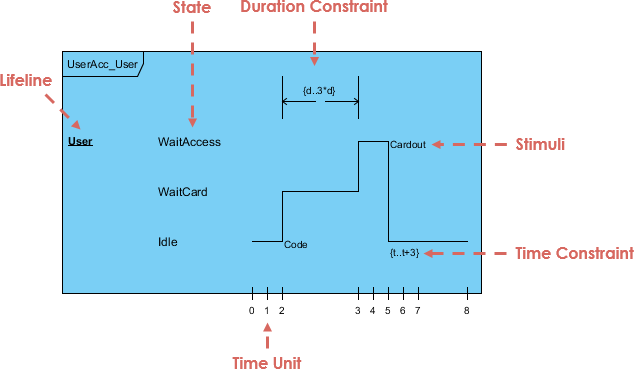
⏳ Example: A self-driving car must detect obstacles within 100ms—timing diagrams ensure this constraint is met.
7. Interaction Overview Diagram (IOD)
- A high-level view of interaction flows—like a flowchart of sequence diagrams.
- Combines multiple interactions into a single diagram.
- Best for: Complex workflows involving multiple actors and systems.
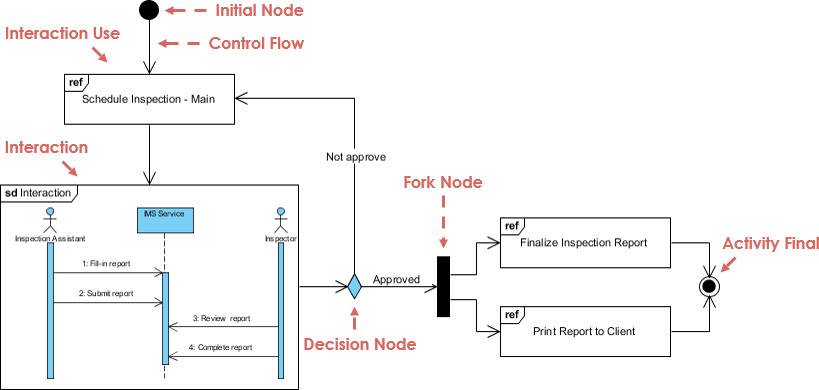
🔄 Example: A multi-step checkout process involving payment, inventory, and shipping systems.
UML Evolution: From UML 1.x to UML 2.0+
✅ UML 2.0 made UML more agile, flexible, and suitable for modern development practices.
AI-Powered UML: Making Modeling Faster, Smarter, and More Collaborative
While UML is powerful, traditional modeling can be time-consuming and error-prone—especially when requirements change frequently in agile environments.
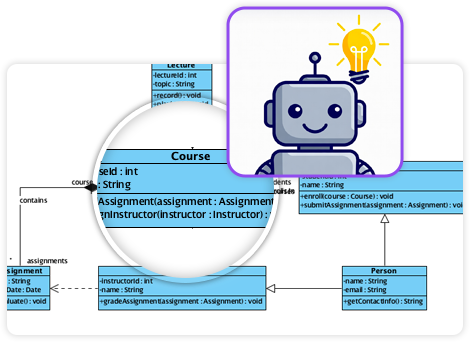
Enter Artificial Intelligence (AI)—transforming UML from a manual task into an intelligent, adaptive process.
🔍 How AI Enhances UML Modeling
🧠 Example: A product manager types:
“Users should be able to sign up, verify email, and reset password if forgotten.”
An AI-powered tool generates a complete Use Case Diagram, Sequence Diagram, and State Machine Diagram in seconds.
🚀 Visual Paradigm’s AI Ecosystem: The Future of UML Modeling
Visual Paradigm is a leading UML modeling tool that has integrated AI capabilities to make UML more agile, accessible, and intelligent.
✨ Key AI Features in Visual Paradigm:
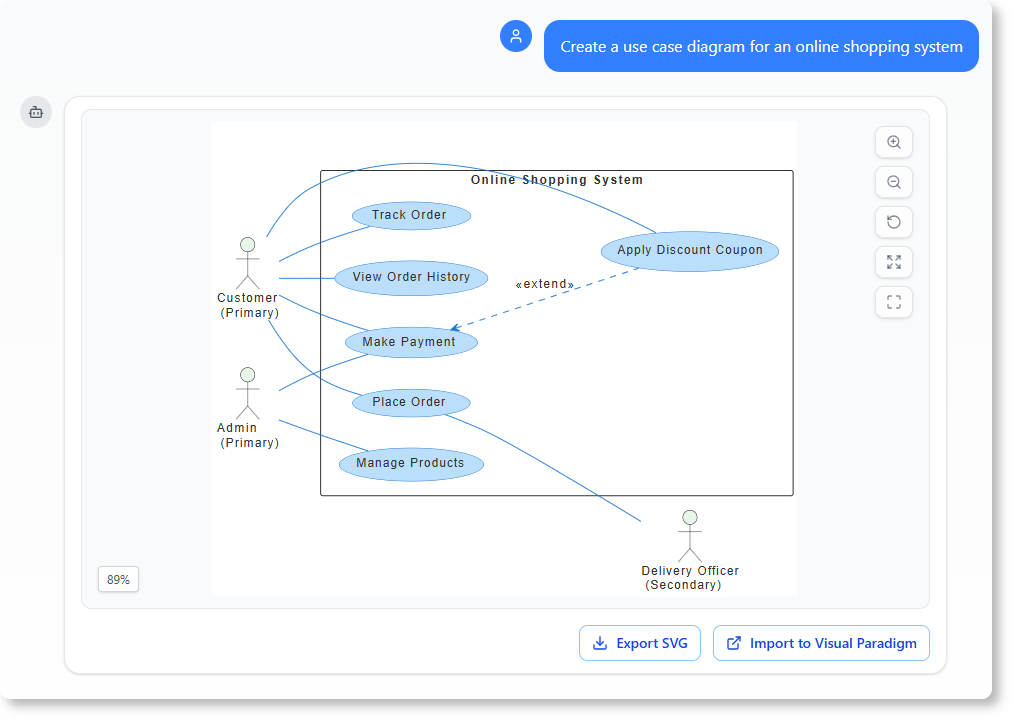
1. AI-Powered Diagram Generation from Text
- Type natural language prompts → get instant UML diagrams.
- Supports all 13 UML diagram types.
- Use Case: A product owner writes:
“Design a system where customers can add items to cart, apply discount codes, and check out using credit card.”
→ Visual Paradigm generates Use Case, Activity, and Sequence Diagrams automatically.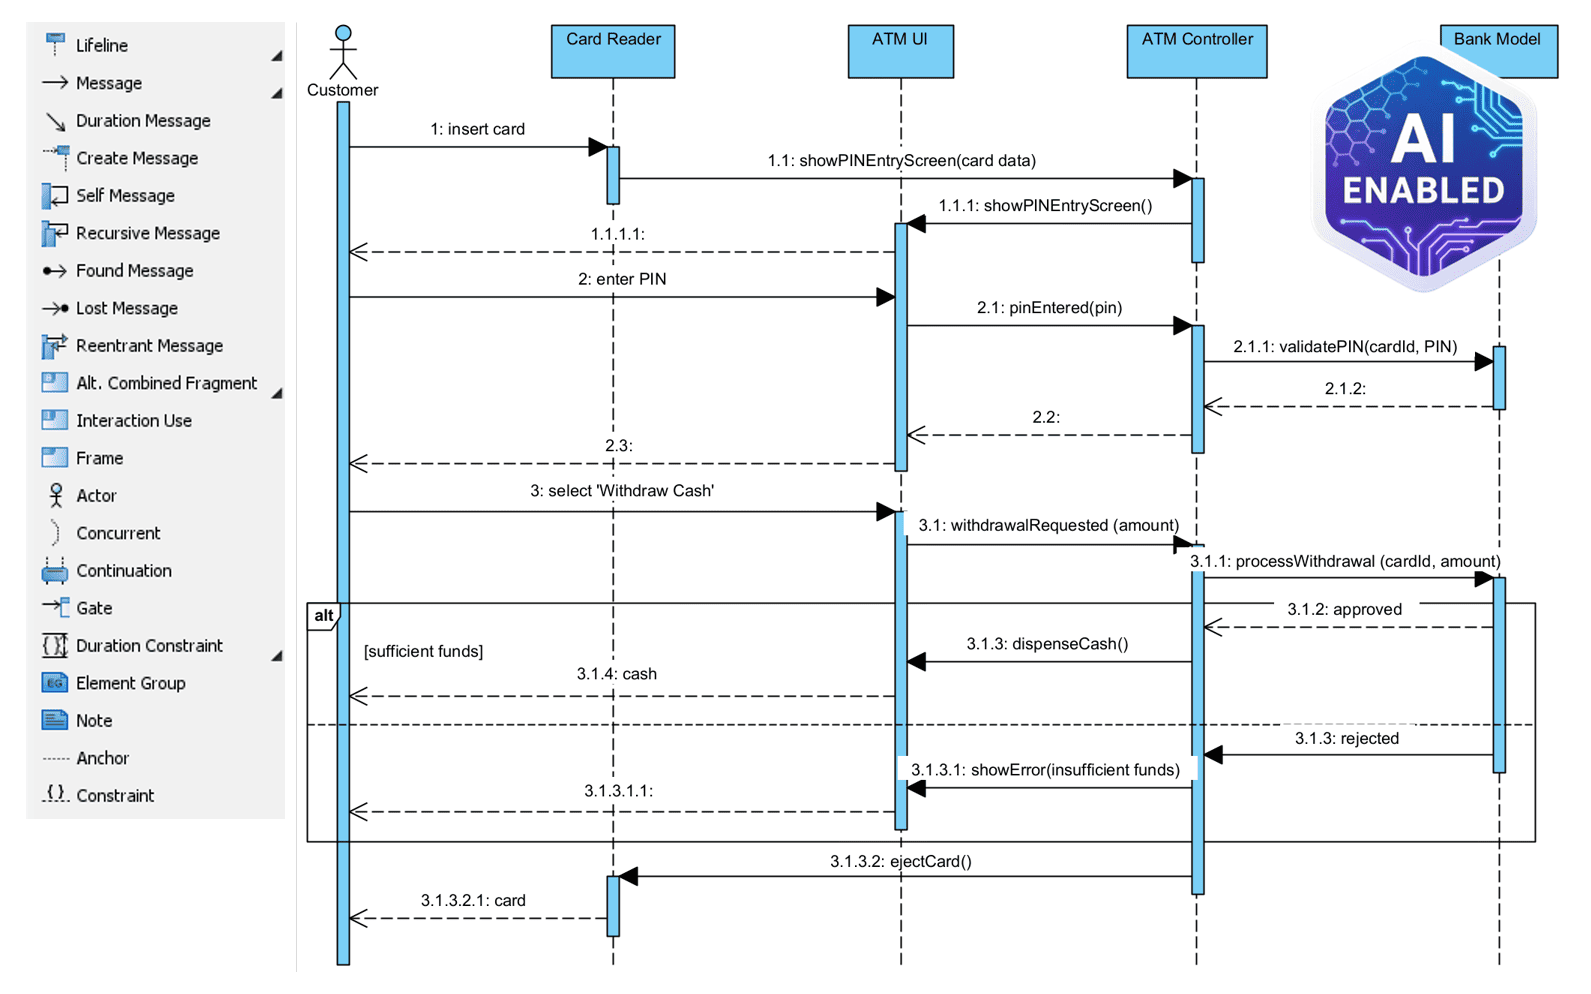
2. Smart Suggestion Engine
- AI suggests:
- Missing relationships (e.g., “You’re missing an association between Order and Payment”)
- Correct multiplicities
- Best practices in class design
- Reduces modeling errors and improves consistency.
3. Auto-Documentation & Summary Generation
- AI generates:
- Plain-language summaries of diagrams
- Requirements traceability reports
- API documentation from component and sequence diagrams
💬 Example: After creating a Component Diagram, AI outputs:
“The system consists of three components: Auth Service (handles login), Payment Gateway (processes transactions), and Email Service (sends notifications). All communicate via REST APIs.”
4. Cross-Diagram Synchronization
- Change a class in the Class Diagram → AI updates Sequence, Use Case, and Activity diagrams automatically.
- Eliminates manual synchronization—critical in agile sprints.
5. Collaboration & Version Control with AI Insights
- AI analyzes team contributions and flags:
- Inconsistent naming
- Redundant diagrams
- Potential design anti-patterns
- Provides real-time feedback during collaborative modeling sessions.
6. Integration with Agile Tools
- Syncs with Jira, Confluence, GitHub, and Azure DevOps.
- AI maps user stories to UML diagrams and generates traceability matrices.
🔄 Example: A Jira ticket titled “Implement password reset” is linked to a Use Case Diagram, Sequence Diagram, and State Machine Diagram—all auto-generated and updated in real time.
🎯 Real-World Case Study: AI-Enhanced UML at a Fintech Startup
Company: FinFlow (a digital banking platform)
Challenge:
The team struggled with misaligned requirements between product, design, and engineering. Manual UML modeling slowed down sprint planning.
Solution:
They adopted Visual Paradigm with AI to:
- Generate UML diagrams from user stories in Jira.
- Auto-update diagrams when requirements changed.
- Share AI-generated summaries with non-technical stakeholders.
Results:
- 60% faster sprint planning
- 40% fewer miscommunication issues
- 30% reduction in rework
- Stakeholders reported higher confidence in system design
✅ “Now, we don’t just build software—we design it together, with AI as our co-pilot.”
— Lead Product Manager, FinFlow
✅ Best Practices for Using UML with AI
- Start with Use Cases → Use AI to generate diagrams from user stories.
- Validate with Stakeholders → Use AI-generated summaries to explain diagrams simply.
- Iterate Quickly → Use auto-update features to keep diagrams in sync.
- Enforce Standards → Let AI enforce naming and structural rules.
- Document Everything → Use AI to generate reports and traceability matrices.
📌 Conclusion: UML + AI = Agile, Intelligent, and Collaborative Design
UML remains the gold standard for visualizing software systems. With the integration of AI, UML is no longer a static, time-consuming task—it’s a dynamic, intelligent, and collaborative process.
Tools like Visual Paradigm’s AI ecosystem are redefining how teams design, document, and communicate about complex systems. By automating the tedious parts of modeling, AI allows engineers and business teams to focus on what truly matters: building better software, faster and together.
📚 Resources & Next Steps
- 📖 Visual Paradigm UML Guide
- 🧠 Try: Visual Paradigm Free Edition
- 🎥 Watch: AI-Powered UML Modeling Demo
- 📊 Explore: UML 2.0 Reference Guide (OMG)
✨ Final Thought:
In the age of AI, the most valuable skill isn’t just knowing how to draw a diagram—it’s knowing how to ask the right questions and let AI help you design the future.
Articles and resources Visual Paradigm AI
-
AI-Powered Visual Modeling and Design Solutions by Visual Paradigm: This portal allows users to explore cutting-edge AI-driven tools for visual modeling, diagramming, and software design to enable faster, smarter development workflows.
-
Visual Paradigm – All-in-One Visual Development Platform: This is a comprehensive platform for visual modeling, software design, and business process modeling that integrates various AI-powered development tools.
-
AI Chatbot Feature – Intelligent Assistance for Visual Paradigm Users: Users can leverage this AI-powered chatbot functionality to get instant guidance, automate tasks, and enhance productivity within the modeling environment.
-
Visual Paradigm Chat – AI-Powered Interactive Design Assistant: This interactive AI chat interface helps users generate diagrams, write code, and solve complex design challenges in real time.
-
AI Textual Analysis – Transform Text into Visual Models Automatically: This tool uses AI to analyze text documents and automatically generate diagrams such as UML, BPMN, and ERD for faster modeling and documentation.
-
AI Brainstorming Features – Visual Paradigm: These features enhance the idea generation process by providing intelligent suggestions and supporting collaborative workflows.
-
AI-Powered Use Case Diagram Refinement Tool – Smart Diagram Enhancement: This tool leverages AI to automatically refine and optimize use case diagrams for improved clarity, consistency, and completeness.
-
AI Fishbone Diagram Generator: This AI-powered tool identifies the root causes of complex problems by automatically generating Fishbone (Ishikawa) diagrams.
-
AI Development Plan Generator – Visual Paradigm: This tool is designed to revolutionize project planning by empowering users to quickly transform ideas into actionable roadmaps and visualized timelines.
-
AI-Powered 3-Aspect Infographic Designer Tool: This AI-driven designer tool enables the instant generation of professional infographics based on user input.
This post is also available in Deutsch, Español, فارسی, Français, English, Bahasa Indonesia, 日本語, Polski, Portuguese, Ру́сский, Việt Nam, 简体中文 and 繁體中文.