
Introduction: Your Journey to Professional Business Process Modeling
Welcome to your comprehensive guide on mastering business process design using Visual Paradigm’s powerful BPMN (Business Process Model and Notation) software. This guide will walk you through every stage of your journey, from initial process mapping to advanced simulation and analysis.
Stage 1: Discovering Visual Process Modeling
Understanding BPMN Business Process Diagrams
Your journey begins with creating professional Business Process Diagrams (BPD). BPMN provides a graphical representation of business workflows that anyone—from business analysts to stakeholders—can easily understand. This visual language aids in business process analysis and continuous improvement initiatives.
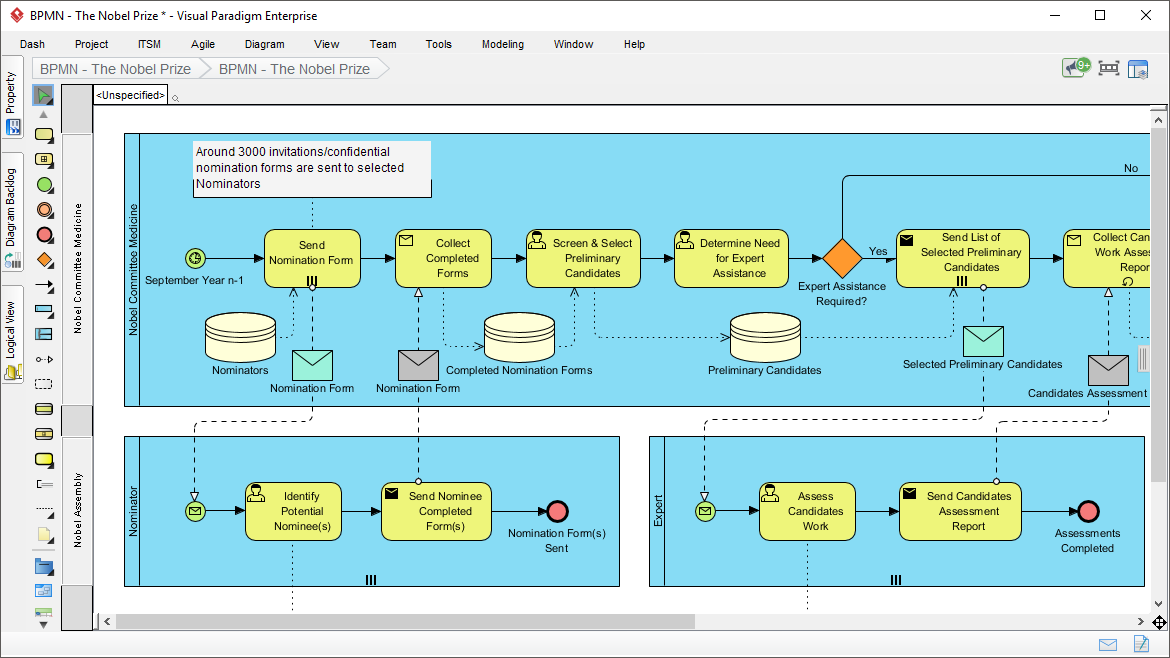
Visual Paradigm features an intuitive BPMN 2.0 modeler that enables you to create professional Business Process Diagrams quickly and smoothly. The platform’s user-friendly interface removes the complexity traditionally associated with business process modeling, allowing you to focus on what matters most: designing efficient, effective processes.
Key Benefits at This Stage:
-
Graphical representation accessible to all stakeholders
-
Industry-standard BPMN 2.0 compliance
-
Intuitive drag-and-drop modeling
-
Professional-quality diagrams from day one
Stage 2: Diving Deeper with Process Drill-Down
Managing Complexity Through Hierarchical Modeling
As your processes grow in complexity, you’ll need tools to manage that complexity without losing clarity. Visual Paradigm’s process drill-down capability allows you to “open up” sub-processes and model lower-level process flows in separate business process diagrams.
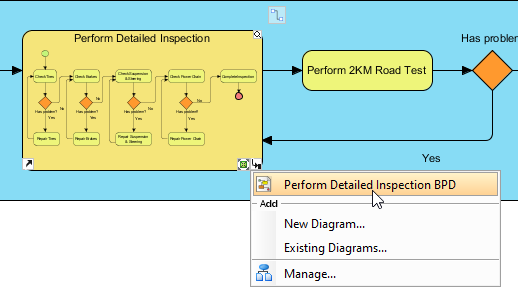
This hierarchical approach means you can:
-
Collapse sub-processes to hide details when presenting high-level overviews
-
Expand sub-processes to view detailed lower-level process flows when needed
-
Maintain clarity at every level of abstraction
-
Navigate seamlessly between different levels of detail
User Experience Tip: Start with a high-level process map, then progressively drill down into complex activities. This keeps your diagrams clean and your stakeholders engaged.
Stage 3: Breaking Boundaries with Multi-Standard Integration
Mapping Processes with Any Modeling Standard
Real-world business processes don’t exist in isolation. They connect to software systems, databases, user interfaces, and organizational structures. Visual Paradigm recognizes this reality by offering all-rounded visual modeling capabilities that integrate multiple standards.
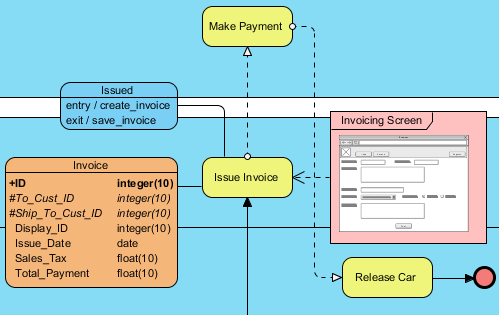
In your process designs, you can map process flow with various modeling artifacts:
-
UML shapes for software architecture integration
-
ERD entities for database design alignment
-
Wireframes for user interface planning
-
And many other modeling standards
This integration capability ensures that your business processes connect seamlessly with technical implementation, creating a complete picture from business requirements to technical delivery.
Stage 4: Specifying Operational Details
Working Procedure Editor for Detailed Documentation
While a Business Process Diagram provides a bird’s eye view of workflows, individual business activities require detailed operational procedures. The Working Procedure Editor bridges this gap by allowing you to specify the exact steps, rules, and guidelines for each business activity.
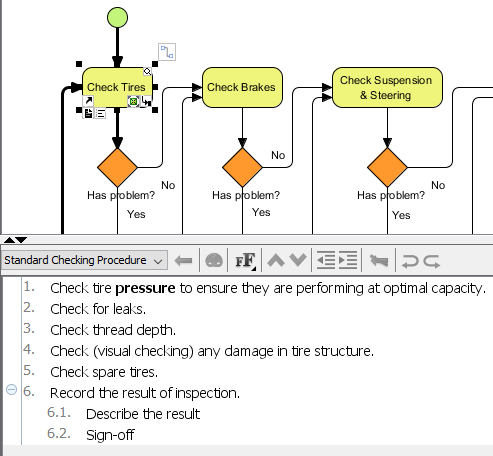
What You Can Achieve:
-
Document step-by-step operational procedures for each process activity
-
Create comprehensive process specifications
-
Combine process diagrams with working procedures in unified documentation
-
Share standardized guidelines across your team
This feature transforms your process models from abstract diagrams into actionable, implementable workflows that team members can follow with confidence.
Stage 5: Transforming Processes from Current to Future State
As-is and To-be Process Modeling
Process improvement begins with understanding where you are and where you want to go. Visual Paradigm’s As-is and To-be modeling capability enables you to produce a target process model (To-be) from your baseline (As-is), then edit the target to represent expected improvements.
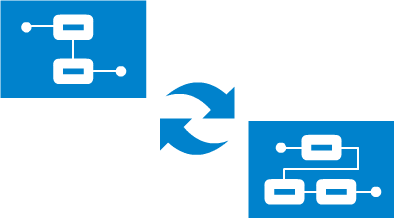
The Transformation Journey:
-
Document Current State: Model your existing processes as they currently operate
-
Create Target State: Generate a To-be model from your As-is baseline
-
Design Improvements: Edit the To-be model to incorporate process reengineering
-
Maintain Traceability: Navigate smoothly between the two models with automatic traceability
This approach ensures that improvement initiatives are grounded in reality while providing a clear roadmap for change.
Stage 6: Clarifying Responsibilities with RACI & CRUD Charts
Visualizing Roles and Data Operations
Understanding who does what—and how data flows through your processes—is critical for successful implementation. Visual Paradigm provides powerful matrix tools to clarify these relationships.
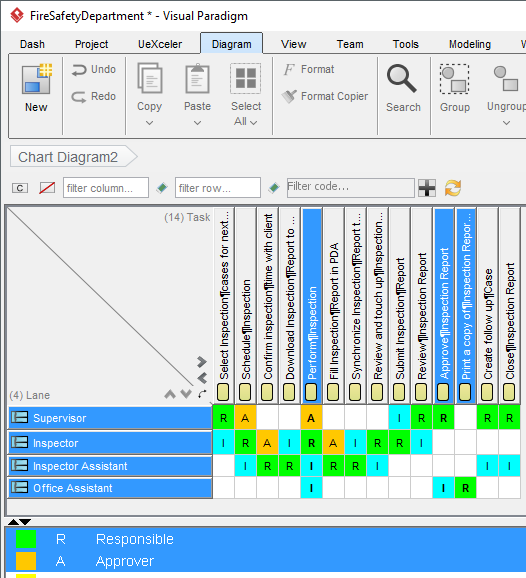
RACI Chart: Defining Responsibilities
A RACI chart is a matrix that presents the different responsibilities of diverse people, teams, departments, or business units in completing business activities. The chart involves:
-
Rows: Participants (individuals, teams, departments)
-
Columns: Business activities
-
Cells: Responsibility markers (R, A, C, or I)
Responsibility Types:
-
R (Responsible): Those who do the work
-
A (Accountable): Those ultimately answerable
-
C (Consulted): Those whose opinions are sought
-
I (Informed): Those who are kept up-to-date
Generate RACI Chart from BPD:
Instantly form a RACI chart from your Business Process Diagram, with responsibility ‘R’ automatically assigned based on process content.
CRUD Chart: Tracking Data Operations
Beyond responsibilities, you need to understand how data moves through your processes. CRUD charts indicate the Creation, Reading, Updating, or Deletion of data objects throughout your process flow.
Generate CRUD Chart from BPD:
Instantly form a CRUD chart from your BPD to visualize data operations across all process activities.
You can also create custom charts tailored to your specific organizational needs.
Stage 7: Bringing Processes to Life with Animation
Process Animation for Dynamic Understanding
Static diagrams are useful, but watching your process flow in action provides insights that static images cannot. Visual Paradigm’s Process Animation tool makes your business process design come alive.
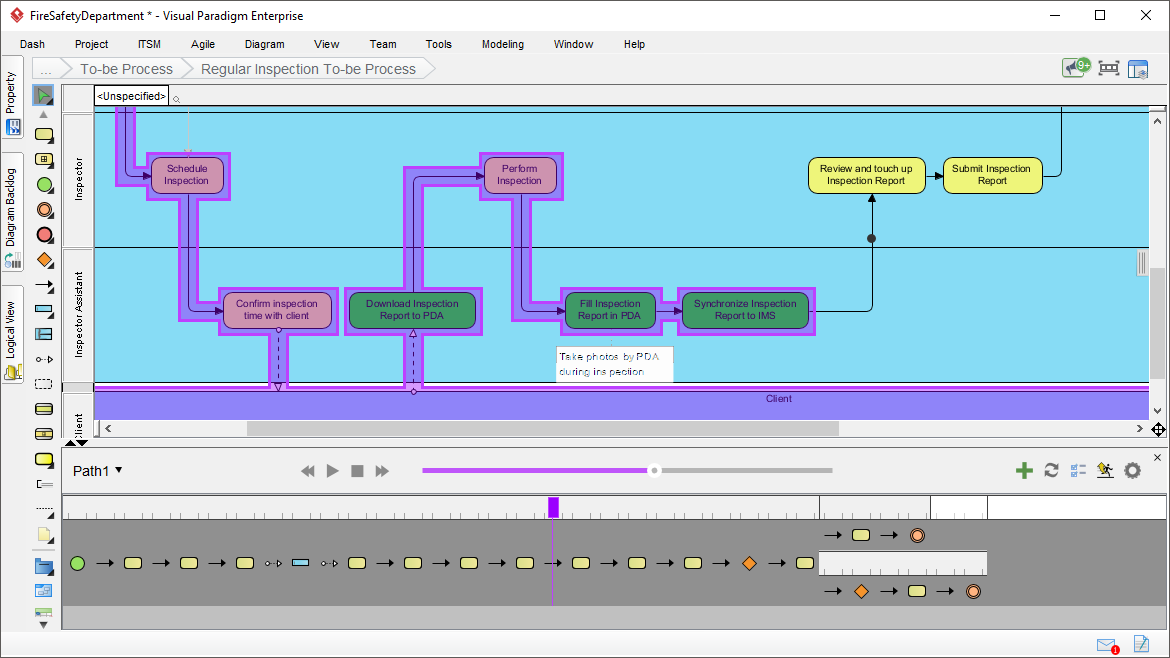
Animation Benefits:
-
Clear Barriers: Removes confusion encountered when studying process flow with static images
-
Automatic Analysis: The tool analyzes process flows and converts designs into animations
-
Shareable Results: View animations in motion with clients and colleagues
-
Enhanced Communication: Stakeholders can see exactly how the process works
This dynamic visualization helps identify bottlenecks, validate logic, and ensure everyone shares the same understanding of process behavior.
Stage 8: Testing Processes with Simulation
Process Simulation for Real-World Validation
Before implementing process changes in the real world, you need to understand their impact. Visual Paradigm’s Process Simulation allows you to visually simulate business process execution to study resource consumption, evaluate costs, identify bottlenecks, and trial-run improvement options.
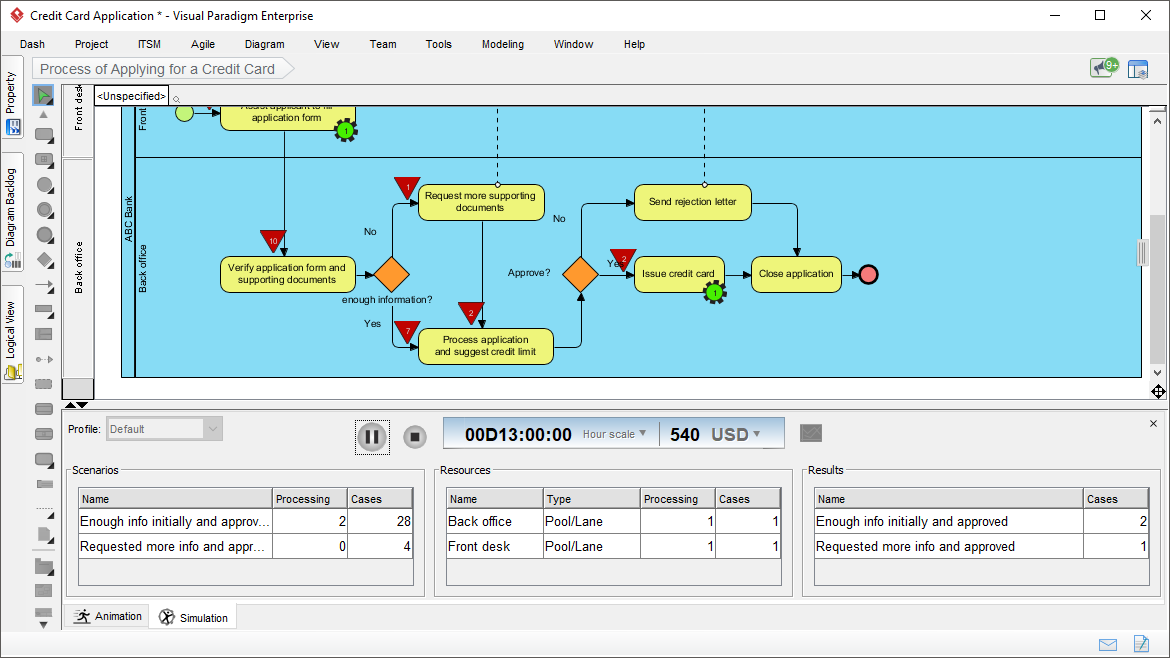
Resource Allocation
Specify the resources required to execute your business process, including:
-
Human resources
-
Devices and equipment
-
Resources required by each task and sub-process
This detailed specification enables accurate capacity planning and resource optimization.
Configurable Time Scale
Simulate your business process across different time scales:
-
Real-time: Watch execution as it happens
-
Minute scale: Compress hours into minutes
-
Hour scale: View days in hours
-
Day scale: Observe long-term processes quickly
See the entire execution timeline at your preferred pace.
Cost Evaluation with Selectable Currency
Understand the financial impact of your processes:
-
Specify cost per task and sub-process
-
Select your preferred currency
-
Evaluate total process costs automatically
This feature supports data-driven decision-making for process improvements.
Completion Chart
Identify the status of inputs completion against time. This visualization helps you understand:
-
When deliverables are completed
-
Whether timelines are realistic
-
Where delays might occur
Resource Usage Chart
Track the consumption of resources by different business activities throughout process execution. This chart reveals:
-
Resource bottlenecks
-
Underutilized capacity
-
Opportunities for optimization
Queue Time Chart
See how long flow objects spend waiting at various points in the process. This is crucial for:
-
Identifying bottlenecks: Spot where work piles up
-
Reducing cycle time: Target waiting periods for improvement
-
Improving efficiency: Streamline handoffs and transitions
Stage 9: Leveraging the Complete Visual Modeling Suite
Enterprise-Grade Capabilities Beyond BPMN
Visual Paradigm is more than just a BPMN tool—it’s a comprehensive visual modeling platform that supports your entire software development and business transformation lifecycle.
![]()
Enterprise Architecture
-
ArchiMate® 3 (Certified): Enterprise architecture modeling
-
DoDAF, NAF, MODAF: Defense and military architecture frameworks
-
TOGAF® ADM Guide-Through: Architecture Development Method guidance
-
TOGAF® ADM Process-Map: Just-in-time templates
![]()
Project Management
-
PMBOK® Process Map: Project management best practices
-
Project Management Guide-Through: Lifecycle guidance
-
Project Management Process Map: Ready-to-use templates
![]()
Visual Modeling
-
UML Tool: Unified Modeling Language for software design
-
SysML Tool: Systems Modeling Language
-
ER Diagram Tool: Entity-Relationship diagrams for database design
-
DFD Tool: Data Flow Diagrams
![]()
Agile & Scrum
-
User Story Map: Agile requirements management
-
Scrum Process Canvas: Scrum framework visualization
-
LeSS Canvas: Large-Scale Scrum
-
Nexus Canvas: Scaled agile framework
![]()
Business Modeling
-
BPMN Diagrams: Business Process Model and Notation
-
Decision Table: Complex business rules documentation
-
Organization Chart: Organizational structure visualization
-
CMMN Tool: Case Management Model and Notation
![]()
User Experience Design
-
Wireframe & Storyboard: UI/UX design tools
-
Wireflow Diagram: User flow visualization
-
Prototyping Tool: Interactive prototypes
-
Customer Journey Map: Customer experience mapping
-
High-Fidelity Mockup Tool: Detailed UI designs
![]()
Visual Diagramming
-
Flowchart Maker: General-purpose flowcharts
-
Chart Maker: Various chart types
![]()
Code Engineering
-
Code Engineering: Forward and reverse engineering
-
Visual REST API Designer: API design and documentation
-
DB Generation & Reversal: Database engineering
-
Hibernate ORM: Object-relational mapping
![]()
Team Collaboration
-
Collaboration Tools: Team workspace features
-
Task Management: Project task tracking
-
Review and Commenting: Collaborative design review
![]()
Analysis & Charting
-
Textual Analysis: Requirements extraction
-
Relationship Matrix: Impact analysis
-
Analysis Diagram: Dependency visualization
-
RACI & CRUD: Responsibility and data matrices
![]()
Advanced Modeling Tools
-
Project Glossary: Terminology management
-
On-Demand Model ETL: Model transformation
-
Other Advanced Modeling Tools: Extended capabilities
![]()
Project Management Diagrams
-
Enhanced PERT Chart: Project scheduling
-
Work Breakdown Structure: Project decomposition
-
Cause & Effect Diagram: Root cause analysis
-
Gantt Chart Tool: Project timeline visualization
Stage 10: Choosing Your Edition
Visual Paradigm offers multiple editions to match your needs:
-
Visual Paradigm Standard: Core BPMN features, RACI/CRUD charts, animation
-
Visual Paradigm Professional: Advanced simulation, enhanced collaboration
-
Visual Paradigm Enterprise: Full suite with enterprise architecture tools
Note: As-is and To-be Process, RACI & CRUD charts, Process Animation, and Process Simulation are available in Standard, Professional, and Enterprise editions.
Your Journey Continues
You now have a comprehensive roadmap for mastering business process design with Visual Paradigm. From initial process mapping through advanced simulation and analysis, each stage builds on the previous one to create a complete business process management capability.
Ready to begin? Start with simple process diagrams, gradually incorporate advanced features, and watch as your organization’s processes become clearer, more efficient, and better aligned with strategic goals.
Reference List
- Business Process Modeling: Comprehensive BPMN diagram and modeling tools for creating professional business process diagrams
- Import and Export: Versatile output formats for sharing and integrating your process models
- UML Tool: Unified Modeling Language tools for software design and architecture
- ERD Tool: Entity-Relationship Diagram tools for database design and modeling
- Wireframing Tools: UX design and wireframe creation capabilities for user interface design
- Visual Paradigm Standard Edition: Standard edition features and capabilities overview
- Visual Paradigm Professional Edition: Professional edition advanced features and tools
- Visual Paradigm Enterprise Edition: Enterprise edition complete suite with all features
- ArchiMate Tools: Certified ArchiMate 3 enterprise architecture modeling
- DoDAF Tool: Department of Defense Architecture Framework modeling
- NAF Tool: NATO Architecture Framework support
- MODAF Tool: Ministry of Defence Architecture Framework tools
- TOGAF ADM Tools: TOGAF Architecture Development Method guide-through
- TOGAF Templates: Just-in-time TOGAF ADM process maps and templates
- PMBOK Templates: PMBOK process maps and project management templates
- Project Management Guide: Project management lifecycle guide-through tools
- Project Management Templates: Just-in-time project management process maps
- SysML Tool: Systems Modeling Language for systems engineering
- Database Design Tools: Comprehensive database design and ERD modeling
- DFD Tool: Data Flow Diagram tools for system analysis
- User Story Mapping: Agile user story mapping for requirements management
- Scrum Process Canvas: Scrum framework visualization and guidance
- LeSS Framework: Large-Scale Scrum (LeSS) canvas and tools
- Nexus Framework: Nexus scaled agile framework support
- Decision Table Tool: Business rules documentation with decision tables
- Organization Chart: Organizational structure visualization tools
- CMMN Tool: Case Management Model and Notation diagrams
- UX Design Tools: Complete user experience design and wireframing suite
- Wireflow Diagram: User flow and wireflow diagram creation
- Prototyping Tool: Interactive prototyping capabilities
- Customer Journey Map: Customer experience journey mapping tools
- High-Fidelity Mockup: High-fidelity website and UI mockup design
- Flowchart Maker: General-purpose flowchart creation tools
- Chart Maker: Various chart types for data visualization
- Code Engineering Tools: Forward and reverse code engineering capabilities
- Visual API Designer: Visual REST API design and documentation
- Database Engineering Tools: Database generation and reversal engineering
- Hibernate ORM Tools: Hibernate object-relational mapping support
- Collaboration Tools: Team collaboration and workspace features
- Task Management: Project task management and tracking
- Design Review: Collaborative design review and commenting
- Textual Analysis Tool: Requirements extraction from text documents
- Relationship Matrix: Impact analysis with relationship matrices
- Analysis Diagram: Dependency analysis diagrams
- RACI Chart: RACI and CRUD chart generation from BPD
- Glossary Management: Project glossary and terminology management
- Model ETL: On-demand model extraction, transformation, and loading
- Advanced Modeling: Advanced model management toolset
- PERT Chart: Enhanced PERT chart for project scheduling
- Work Breakdown Structure: WBS diagram creation tools
- Cause and Effect Diagram: Fishbone and cause-effect analysis diagrams
- Gantt Chart Tool: Project timeline and Gantt chart creation
- Download Visual Paradigm: Free trial download of Visual Paradigm