A Five Forces analysis can help companies assess industry attractiveness, how trends will affect industry competition, which industries a company should compete in — and how companies can position themselves for success.
Continue reading
Learning one new thing everyday


A Five Forces analysis can help companies assess industry attractiveness, how trends will affect industry competition, which industries a company should compete in — and how companies can position themselves for success.
Continue reading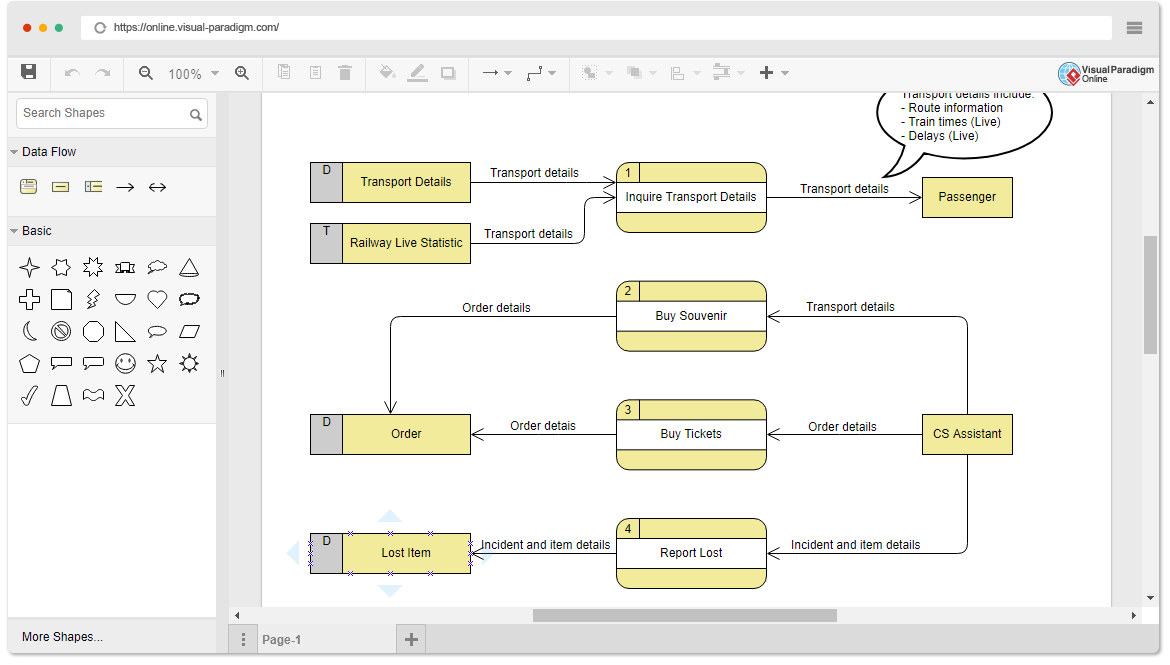
Although data flow oriented modeling is considered as an outdated technology by some software engineers, it is still one of the most widely used requirements analysis symbols. Although data flow diagrams (DFDs) are not formal parts of UML, they can be used to supplement UML diagrams and provide additional insight into system requirements and processes.
Continue reading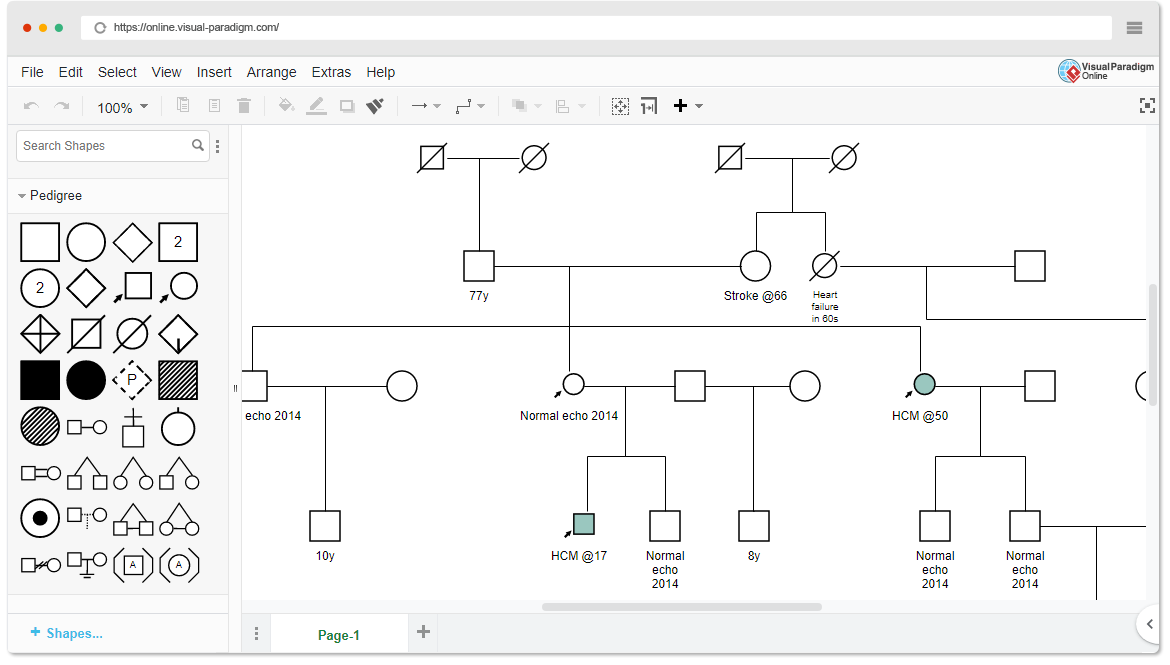
An important tool for geneticists is genealogy. For example, you can use genealogy to track the genetic characteristics of each generation of a family. This is a family history and details about previous generations, which may become uncertain as memory fades.
Continue reading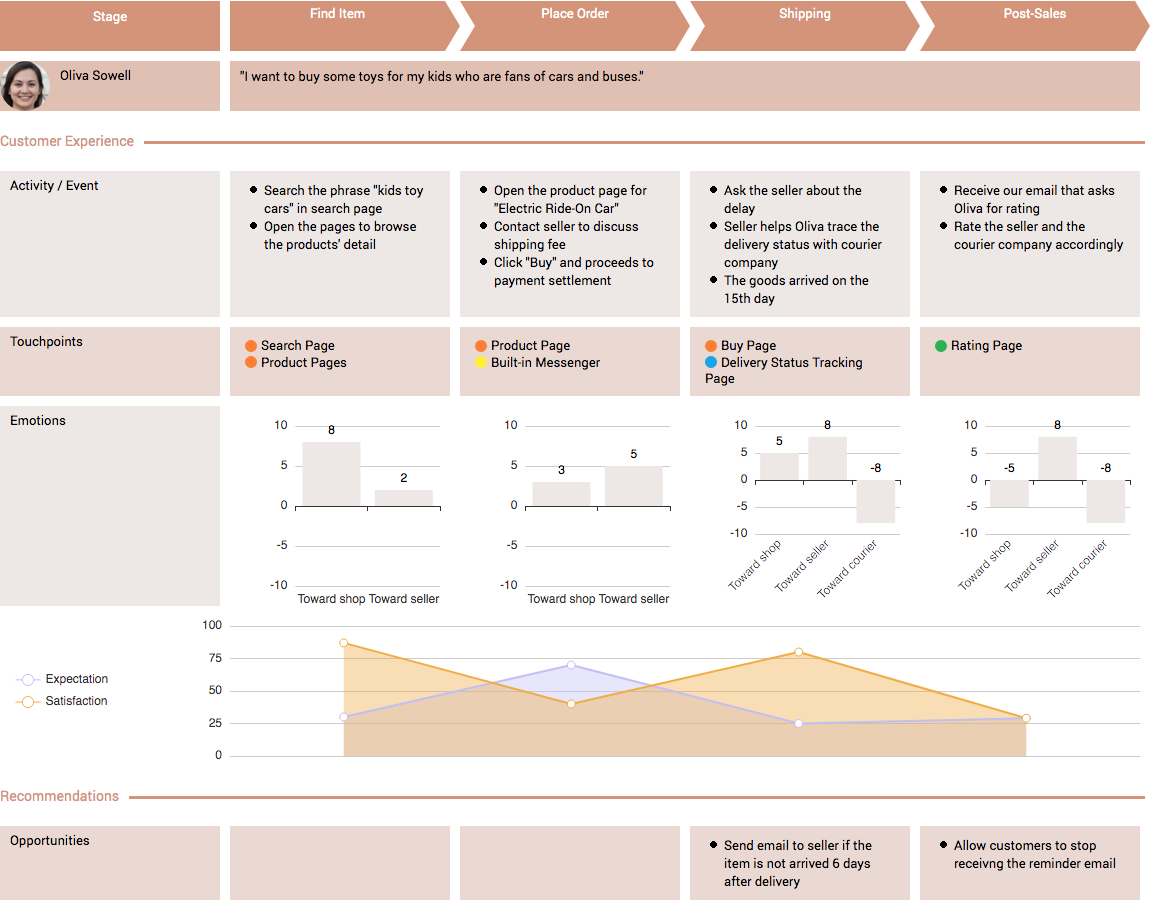
The customer journey map can be used to describe the story of a certain role customer in a specific scenario. Including customers from the first contact with the product, touching the various touch points of the product, and ending the use of the product at the end.
Continue reading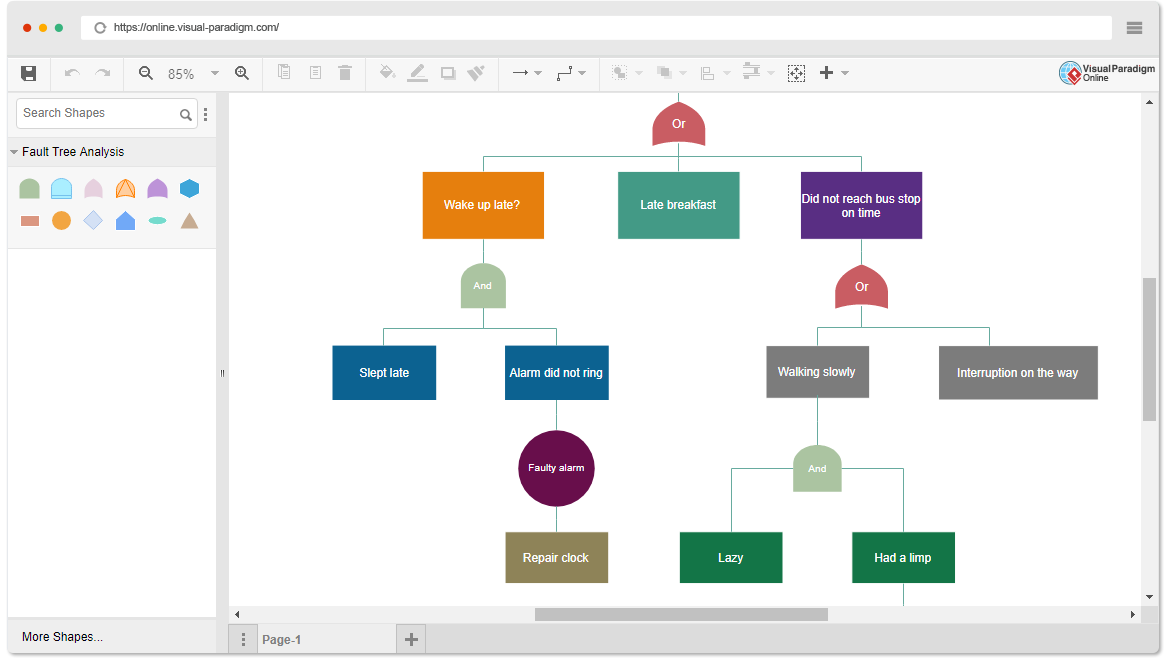
Fault tree analysis is one of the most commonly used methods in system reliability analysis. It is a process of system design or improvement by analyzing various factors that may lead to system failure, including hardware, software, environment, human factors, etc. By drawing the fault tree, we can determine the possible combinations of modes and the probability of the cause of the system failure. The failure probability of the system is calculated and the corresponding measures are taken.
Continue reading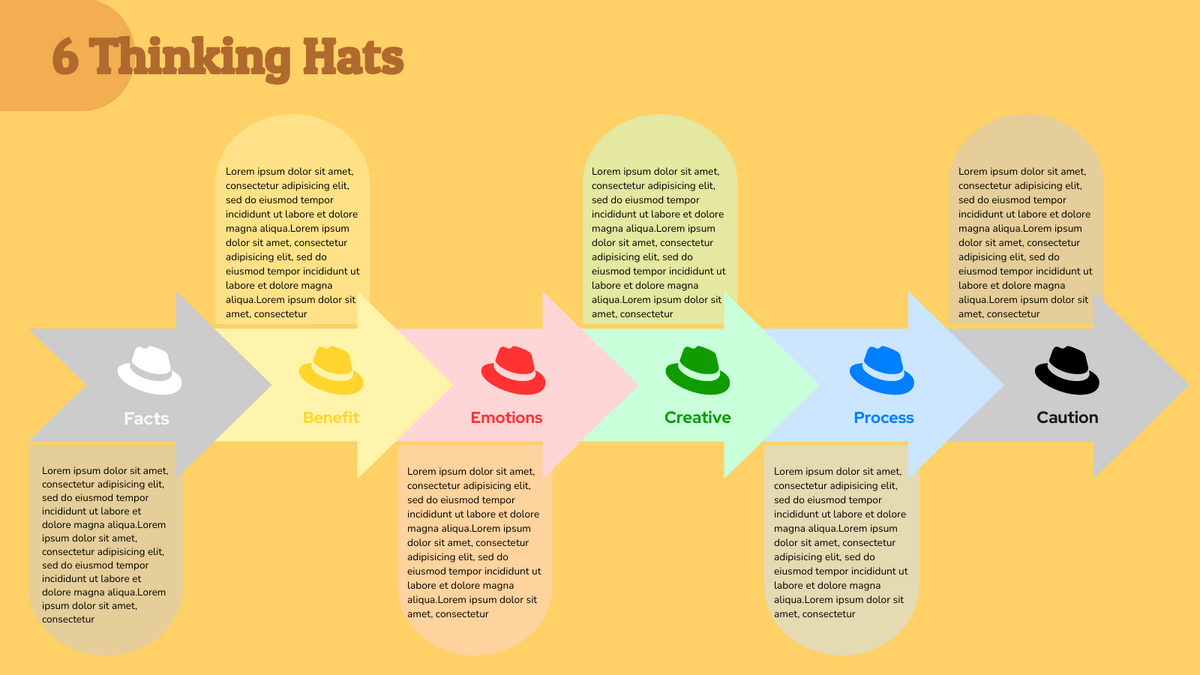
The six thinking hats technique, proposed Edward de Bono in 1999, encourages a group to approach the issue at hand from a number of different perspectives. This forces the team to move outside their habitual thinking style, and helps them to get a more rounded view of a situation. It is an important and powerful technique to debate an issue, solve a problem or to arrive at an important decision.
Continue reading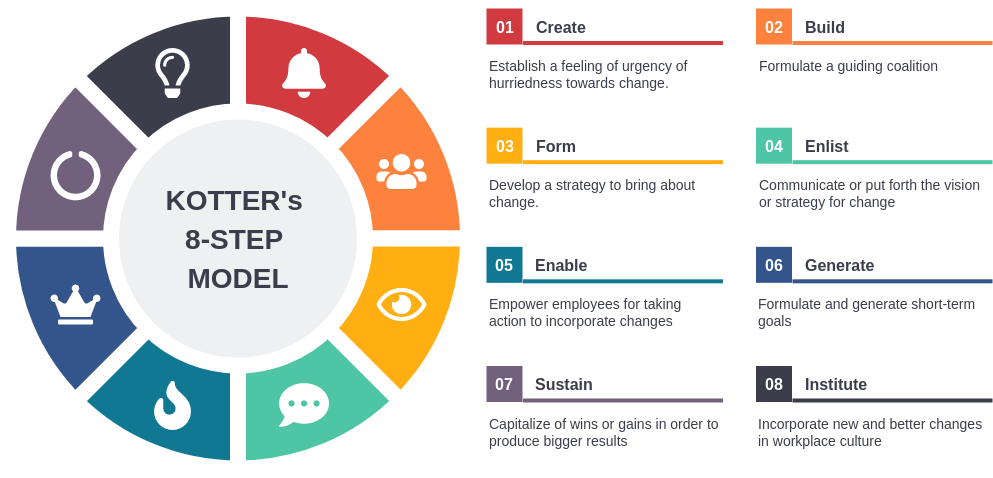
Kotter suggests that for change to be successful, 75% of the practice team needs to “buy into” the change. In other words, you have to really work hard on Step One, and spend significant time and energy building urgency, before moving onto the next steps. Don’t panic and jump in too fast because you don’t want to risk further short-term losses — if you act without proper preparation, you could be in for a very bumpy ride.
Continue reading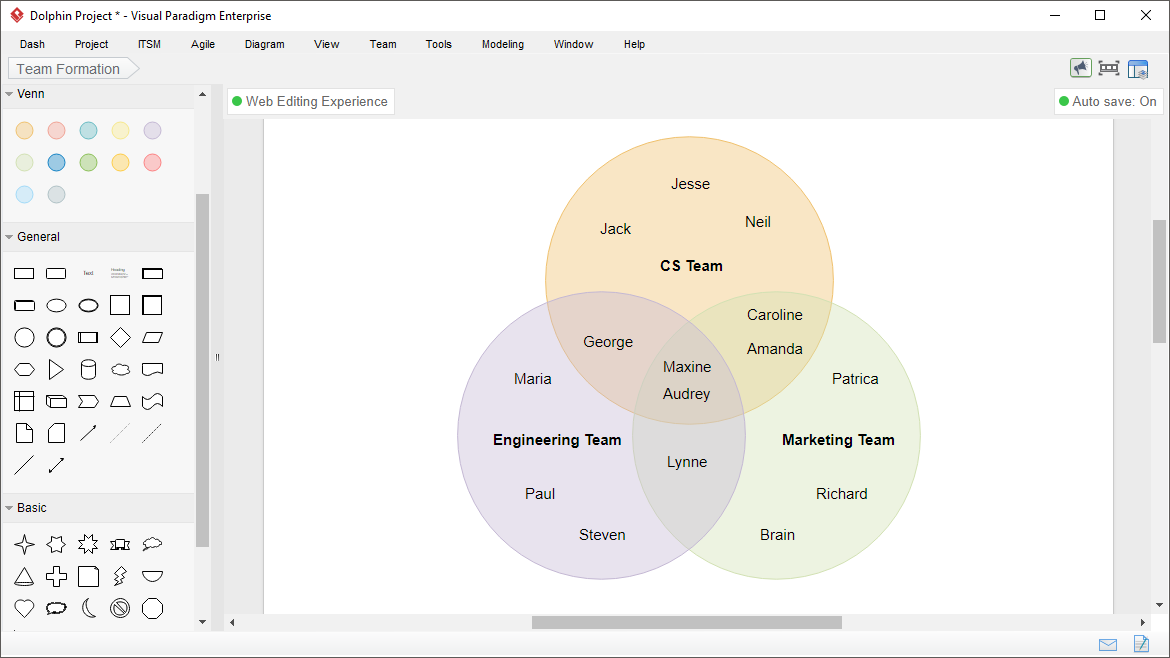
Venn diagrams are graphical or pictorial representations of relationships between different groups of things. Venn Diagram was invented by John Venn around 1880. Venn diagrams are also called set diagrams. Venn diagrams give a logical representation of the groups or sets. Relationships between two or three sets can be easily understood with the help of Venn diagrams. In mathematics, Venn diagrams are used to analyze known information obtained from surveys, data reports, and tables.
Continue reading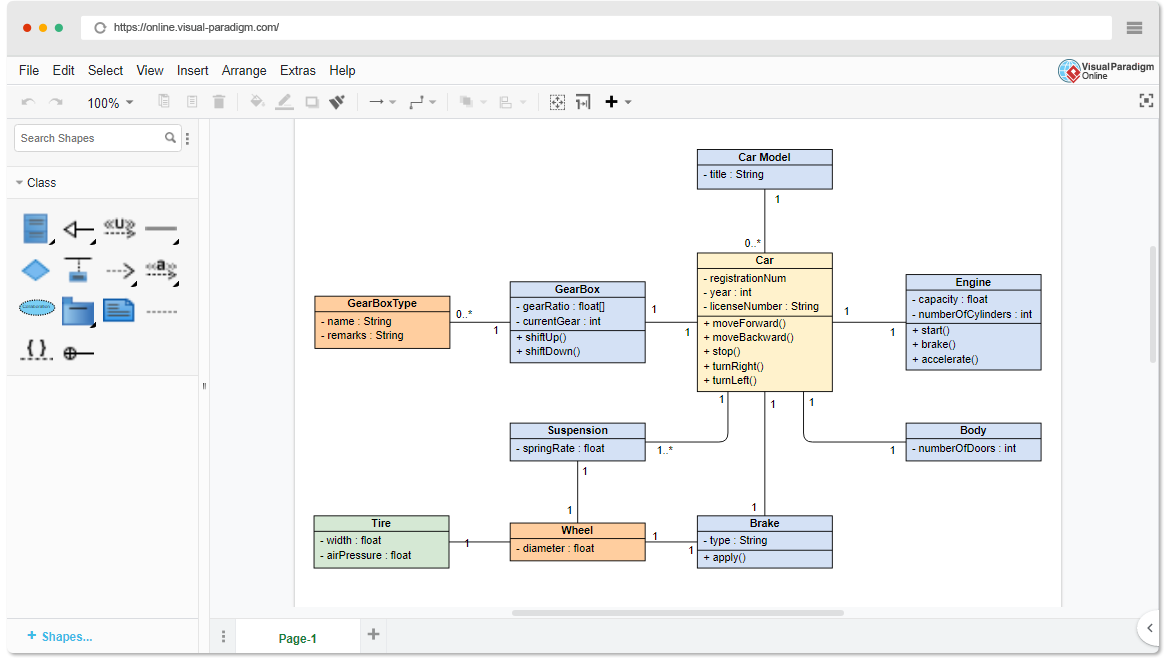
The Unified Modeling Language is a standardized general-purpose modeling language and nowadays is managed as a de facto industry standard by the Object Management Group (OMG). UML includes a set of graphic notation techniques to create visual models for software-intensive systems. In UML 2.2 there are 14 types of UML diagrams, which are divided into two categories
Continue reading
According to Deloitte research, “digitally advanced small businesses” earned more revenue per employee, were more likely to create jobs. The truth is, those who don’t embrace technology may be left behind! And yet, four of five U.S. small businesses aren’t taking full advantage of digital tools available to them. Today I would like to introduce an easy form builder for generating database applications without any IT technical background or coding, such as survey form, student questionnaire, order form, registration form and etc.
Continue reading