


A data flow model is an intuitive way to show how a system processes data. At the analytical level, they should be used to model the way data is processed in existing systems.
After the publication of DeMarco’s book Structured Systems Analysis, data flow model has become more and more widely used in analysis. They are an inherent part of the structured approach developed from this work. The symbols used in these models represent function processing (rounded rectangles), data storage (rectangles), and data movement between functions (labeled arrows).
Why DFD still useful for software development?
Although data flow oriented modeling is considered as an outdated technology by some software engineers, it is still one of the most widely used requirements analysis symbols. Although data flow diagrams (DFDs) are not formal parts of UML, they can be used to supplement UML diagrams and provide additional insight into system requirements and processes.
The data flow model is valuable because tracking and recording how data related to a particular process moves through the system helps analysts understand what is happening. The advantage of data flow diagrams is that, unlike some other modeling symbols, they are simple and intuitive. They can usually be explained to potential system users who may be involved in the analysis and validation of requirements.
Why DFD?
DFD graphically representing the functions, or processes, which capture, manipulate, store, and distribute data between a system and its environment and between components of a system. The visual representation makes it a good communication tool between User and System designer. Structure of DFD allows starting from a broad overview and expand it to a hierarchy of detailed diagrams. DFD has often been used due to the following reasons:
- Logical information flow of the system
- Determination of physical system construction requirements
- Simplicity of notation
- Establishment of manual and automated systems requirements
DFD is a Top-Down Decomposition Process
Data flow modeling is a “top-down” process. First analyze the whole procurement process. The sub-processes are then analyzed in a top-down decomposition fashion.
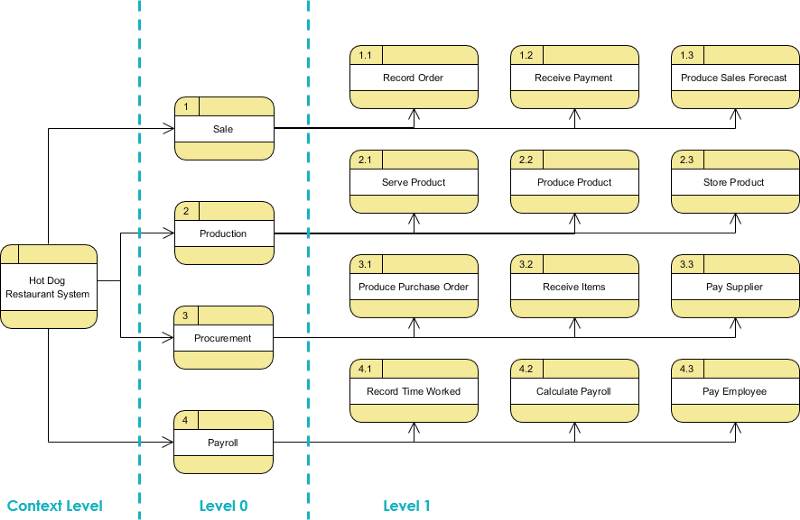
DFD can be used to model systems or software at any level of abstraction. As mentioned before, DFD can be divided into levels that represent an increasing flow of information and functional detail. Level numbers in DFD are 0, 1, 2 or higher. Here, we will see that there are three main levels in the data flow diagram, namely, level 0 DFD, level 1 DFD and level 2 DFD.
Context Diagram — Levels of DFD
Context Diagram (also known as level 0 DFD), it represents the entire software requirement as a bubble, with input and output data represented by input and output arrows.
The system is then decomposed into a DFD with multiple bubbles. The portions of the system represented by each bubble are then broken down and recorded into increasingly detailed Data flow diagrams. This process can be repeated at the necessary levels until the program at hand is fully understood.
The number of inputs and outputs between levels must be maintained, a concept known as DeMacro leveling. Therefore, if bubble “A” has two inputs X1 and X2 and one output Y, then the sub-level data flow diagram(s) representing upper level DFD “A” should have exactly two external inputs and one external output.
In 1-level DFD, context diagram is decomposed into multiple processes.in this level we highlight the main functions of the system and breakdown the high level process of 0-level DFD into subprocesses further to represent details of the processing activities.
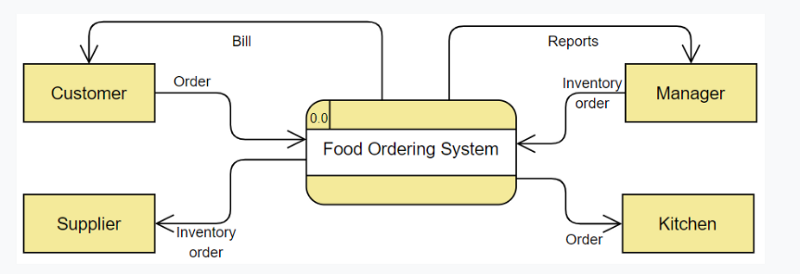
Context diagram (level 0 DFD) — a context diagram DFD is a diagram that represents an overview of the system and its interaction with the rest of the “world”.
Level 1 data flow diagram — level 1 DFD provides a more detailed view of the system than the context diagram by showing the main sub processes and data stores that make up the whole system.
Level 2 (or lower) — a major advantage of data flow modeling technology is that the detailed complexity of real-world systems can be managed and modeled at an abstract level through a technology called “leveling”. Some elements of any data flow diagram can be decomposed (“decomposed”) into a more detailed model at a lower level in the hierarch
DFD Levels — Example— Food Ordering System
Level 0
It is also known as context diagram. It’s designed to be an abstraction view, showing the system as a single process with its relationship to external entities.
- The context diagram must fit in one page.
- The process name in the context diagram should be the name of the information system.
- For example, Grading System, Order Processing System, Registration System.
In 1-level DFD, context diagram is decomposed into multiple processes.in this level we highlight the main functions of the system and breakdown the high level process of 0-level DFD into subprocesses further to represent details of the processing activities.
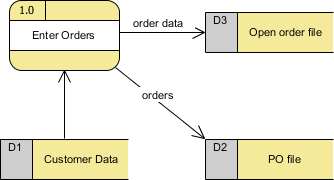
Level 1 — Food Ordering System
In 1-level DFD, context diagram is decomposed into multiple processes.in this level we highlight the main functions of the system and breakdown the high level process of 0-level DFD into subprocesses further to represent details of the processing activities.
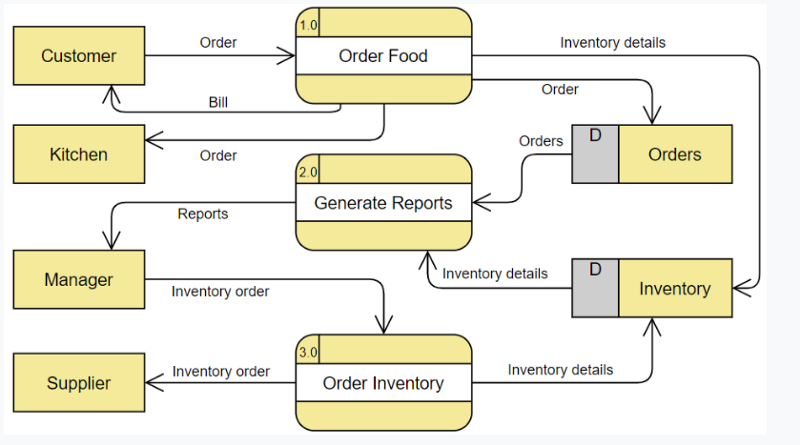
If a process with a lot of data flow linking between a few external entities, we could first extract that particular process and the associated external entities into a separate diagram similar to a context diagram, before you refine the process into a separate level of DFD; and by this way you can ensure the consistency between them much easier.
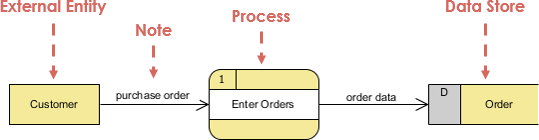
DFD Symbols
There are four basic symbols that are used to represent a data-flow diagram.
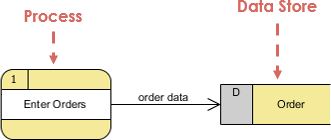
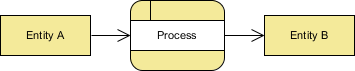
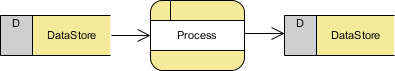
Process
A process receives input data and produces output with a different content or form. Processes can be as simple as collecting input data and saving in the database, or it can be complex as producing a report containing monthly sales of all retail stores in the northwest region.
Every process has a name that identifies the function it performs.
The name consists of a verb, followed by a singular noun.
Example:
- Apply Payment
- Calculate Commission
- Verify Order
DFD Notation
- A rounded rectangle represents a process
- Processes are given IDs for easy referencing

Process Example
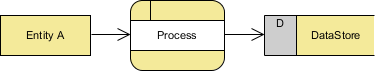
Data Flow
A data-flow is a path for data to move from one part of the information system to another. A data-flow may represent a single data element such the Customer ID or it can represent a set of data element (or a data structure).
Example:
- Customer_info (LastName, FirstName, SS#, Tel #, etc.)
- Order_info (OrderId, Item#, OrderDate, CustomerID, etc.).
Data flow Example:
Notation
- Straight lines with incoming arrows are input data flow
- Straight lines with outgoing arrows are output data flows
Note that:
Because every process changes data from one form into another, at least one data-flow must enter and one data-flow must exit each process symbol.
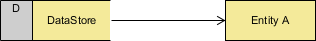
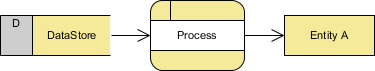
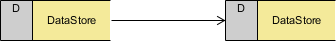
Data Store
A data store or data repository is used in a data-flow diagram to represent a situation when the system must retain data because one or more processes need to use the stored data in a later time.
Notation
- Data can be written into the data store, which is depicted by an outgoing arrow
- Data can be read from a data store, which is depicted by an incoming arrow.
- Examples are: inventory, Accounts receivables, Orders, and Daily Payments.

Data Store Example
Note that:
- A data store must be connected to a process with a data-flow.
- Each data store must have at least one input data-flow and at least one output data-flow (even if the output data-flow is a control or confirmation message).
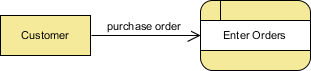
External Entity
An external entity is a person, department, outside organization, or other information system that provides data to the system or receives outputs from the system. External entities are components outside of the boundaries of the information systems. They represent how the information system interacts with the outside world.
- A rectangle represents an external entity
- They either supply data or receive data
- They do not process data
Notation
- A customer submitting an order and then receive a bill from the system
- A vendor issue an invoice

External Entity Example
Note that:
- External entities also are called terminators because they are data origins or final destinations.
- An external entity must be connected to a process through a data-flow.
Rule of Data Flow
One of the rule for developing DFD is that all flow must begin with and end at a processing step. This is quite logical, because data can’t transform on its own with being process. By using the thumb rule, it is quite easily to identify the illegal data flows and correct them in a DFD.
Wrong / Right Description
An entity cannot provide data to another entity without some processing occurred.

Data cannot move directly from an entity to a data story without being processed.
Data cannot move directly from a data store without being processed.
Data cannot move directly from one data store to another without being processed.
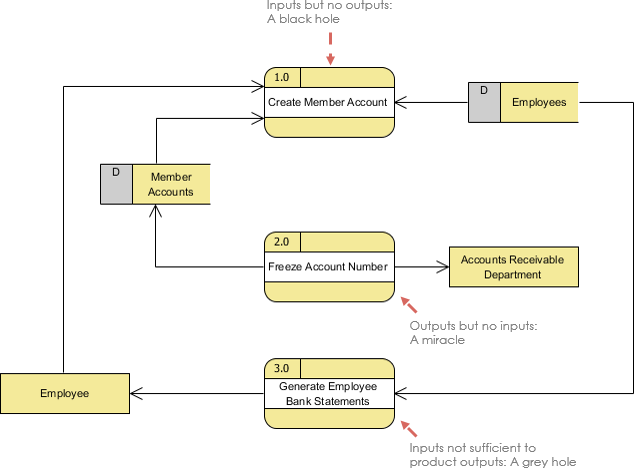
Other frequently-made mistakes in DFD
A second class of DFD mistakes arise when the outputs from one processing step do not match its inputs and they can be classified as:
- Black holes — A processing step may have input flows but no output flows.
- Miracles — A processing step may have output flows but no input flows.
- Grey holes — A processing step may have outputs that are greater than the sum of its inputs
Free UML Tool
- Online Data Flow Diagram Maker
- How to Create Data Flow Diagram (DFD)?
- Data Flow Diagram (DFD) Software
DFD Different Notation
This post is also available in Deutsch, Español, فارسی, Français, English, Bahasa Indonesia, 日本語, Polski, Portuguese, Ру́сский, Việt Nam, 简体中文 and 繁體中文.