


Fault tree analysis is one of the most commonly used methods in system reliability analysis. It is a process of system design or improvement by analyzing various factors that may lead to system failure, including hardware, software, environment, human factors, etc. By drawing the fault tree, we can determine the possible combinations of modes and the probability of the cause of the system failure. The failure probability of the system is calculated and the corresponding measures are taken.
FTA is a design analysis and evaluation methods to improve system reliability. It is often used in the process of Six Sigma, especially in the analysis phase of Six Sigma business improvement process.
How to perform fault tree analysis
Suppose you have a database system failure analysis tree that starts with a database failure and analyzes the factors that can cause database and application failures.
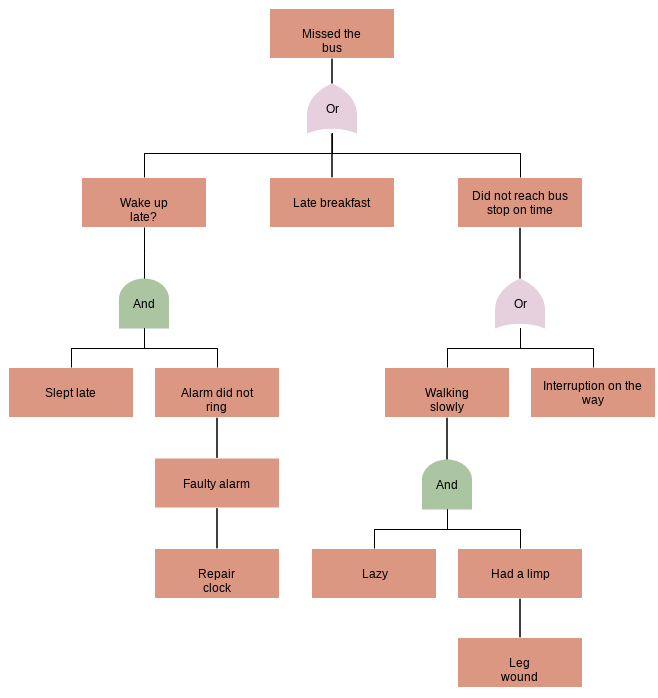
The fault tree analysis is a process of exhausting the causes of failure. It is a top-down analysis where we start with symptoms, take a missed the bus as an example, and then list possible causes in a hierarchical way that forming a tree structure. The tree structure of names comes from the various branches that can cause symptoms.
FTA Notation
A Fault Tree Analysis uses a few basic symbols to outline various points, causes, and effects in a process. There are many symbols, but here are some of the basics to help you get started designing a fault tree diagram.
Symbols are used to represent various events and describe relationships:
Gate Symbols

And gate — represents a condition in which all the events shown below the gate (input gate) must be present for the event shown above the gate (output event) to occur. This means the output event will occur only if all of the input events exist simultaneously.
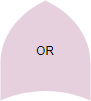
Or gate — represents a situation in which any of the events shown below the gate (input gate) will lead to the event shown above the gate (output event). The event will occur if only one or any combination of the input events exists.
Event symbols
There are five types of event symbols:
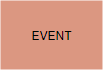
Rectangle — The rectangle is the main building block for the analytical tree. It represents the negative event and is located at the top of the tree and can be located throughout the tree to indicate other events capable of being broken down further. This is the only symbol that will have a logic gate and input events below it.

Circle — A circle represents a base event in the tree. These are found on the bottom tiers of the tree and require no further development or breakdown. There are no gates or events below the base event.
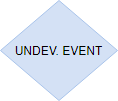
Diamond — The diamond identifies an undeveloped terminal event. Such an event is not fully developed because of a lack of information or significance. A fault tree branch can end with a diamond. For example, most projects require personnel, procedures, and hardware. The tree developer may decide to concentrate on the personnel aspect of the procedure and not the hardware or procedural aspects. In this case, the developer would use diamonds to show “procedures” and “hardware” as undeveloped terminal events.

Oval — An oval symbol represents a special situation that can only happen if certain circumstances occur. This is spelled out in the oval symbol. An example of this might be if switches must be thrown in a specific sequence before an action takes place.

Triangle — The triangle signifies a transfer of a fault tree branch to another location within the tree. Where a triangle connects to the tree with an arrow, everything shown below the connection point transfers to another area of the tree. This area is identified by a corresponding triangle that is connected to the tree with a vertical line. Letters, numbers or figures identify one set of transfer symbols from another. To maintain the simplicity of the analytical tree, the transfer symbol should be used sparingly.
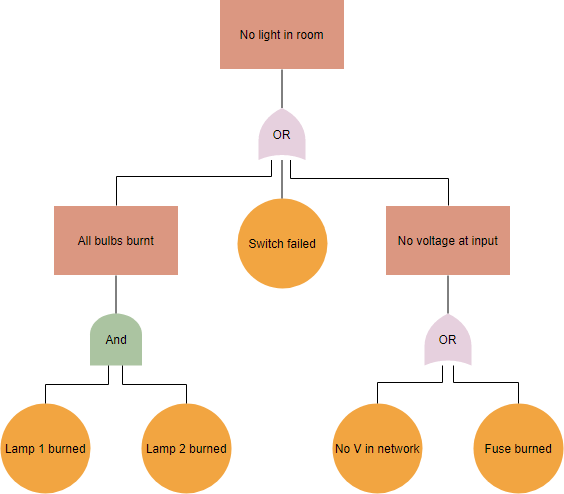
Fault Tree Diagram Example — Light cannot turn on
Let’s look at an example of a basic fault tree analysis: You flip a switch to turn on a light, but the light does not turn on. The fault condition is “No light in the room,” so that’s the beginning of the diagram
Next, what are the potential reasons the light didn’t turn on?
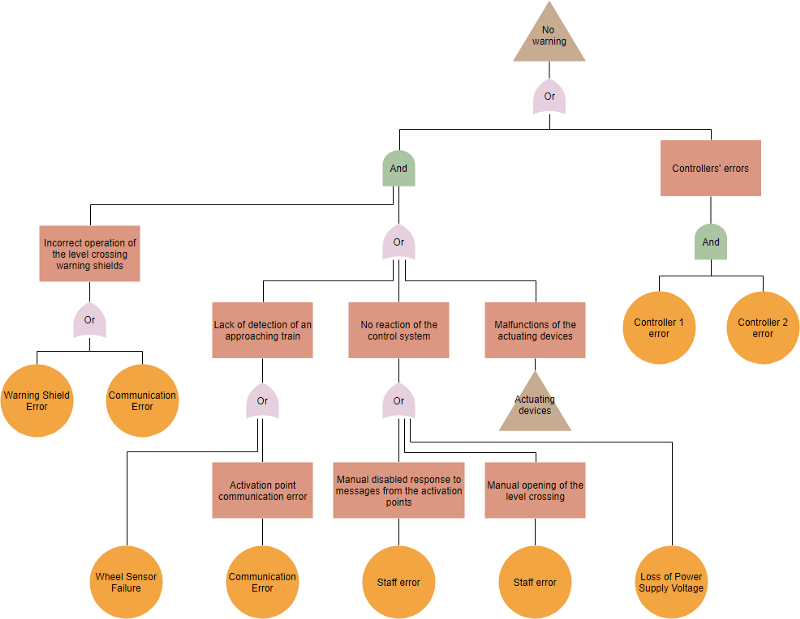
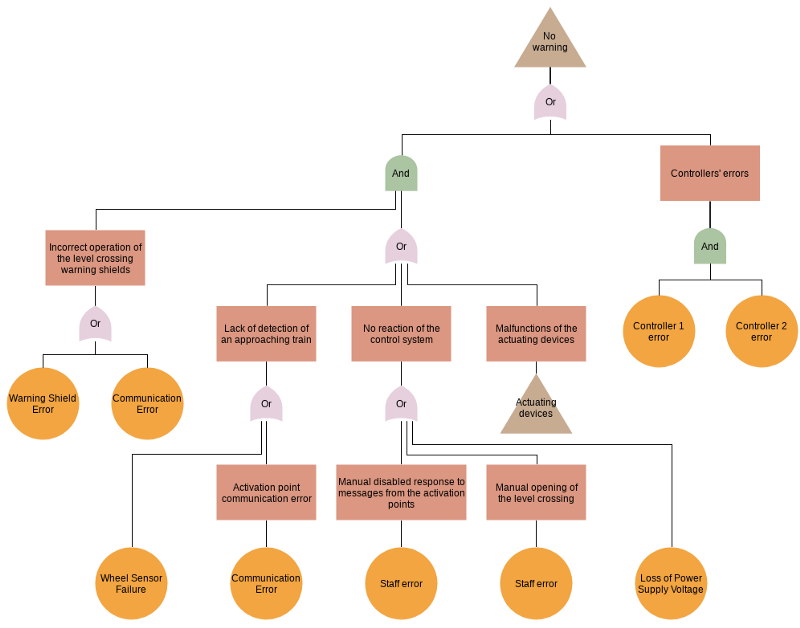
Fault Tree Example — System no Warning Template
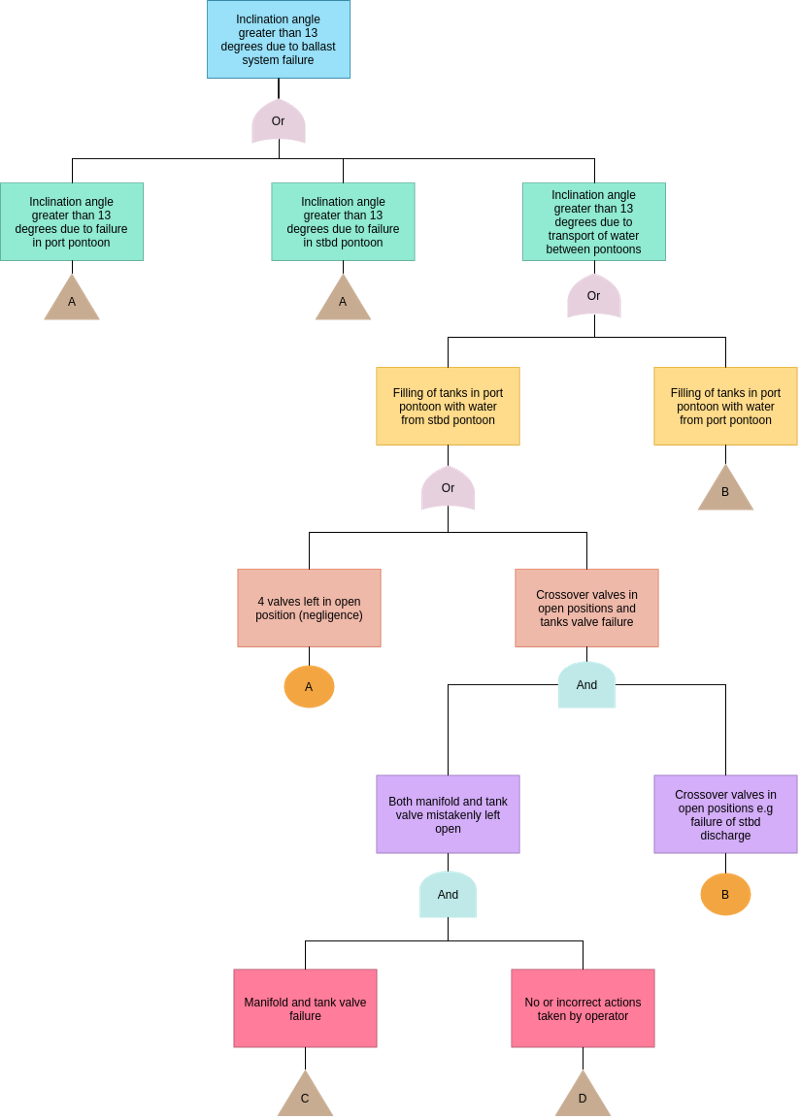
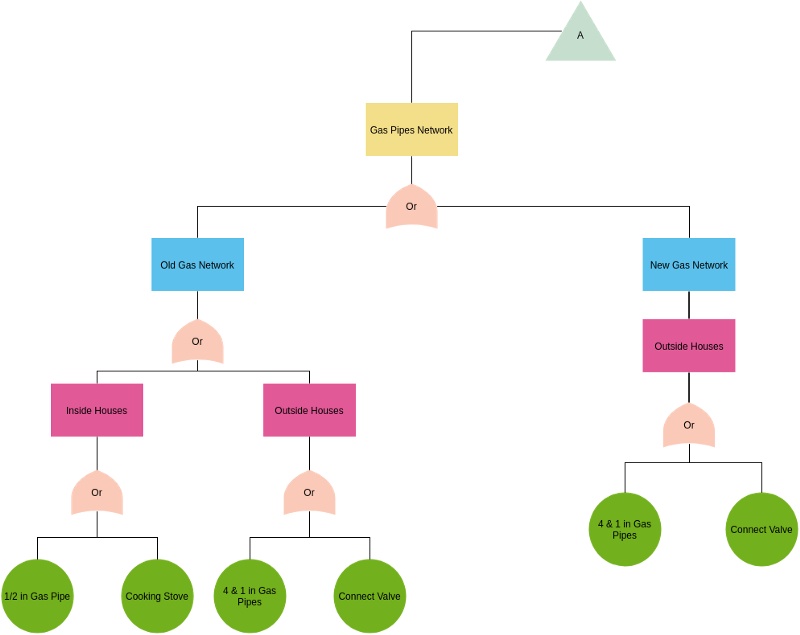
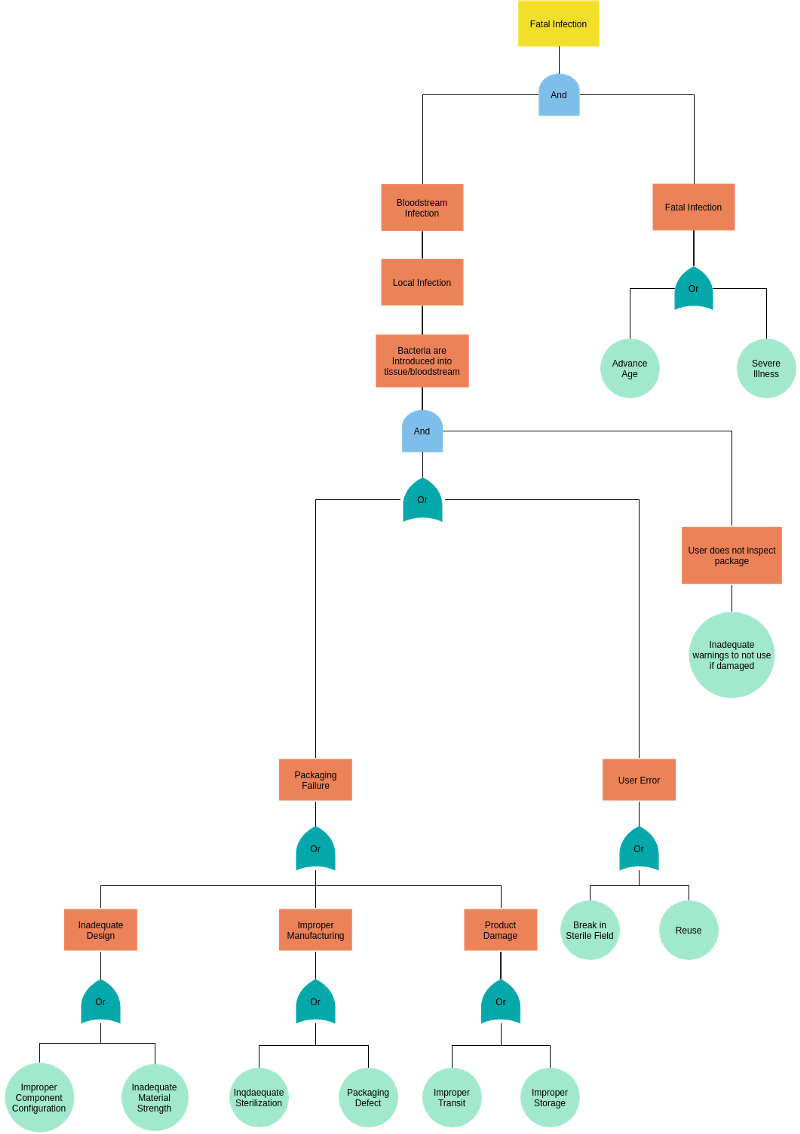
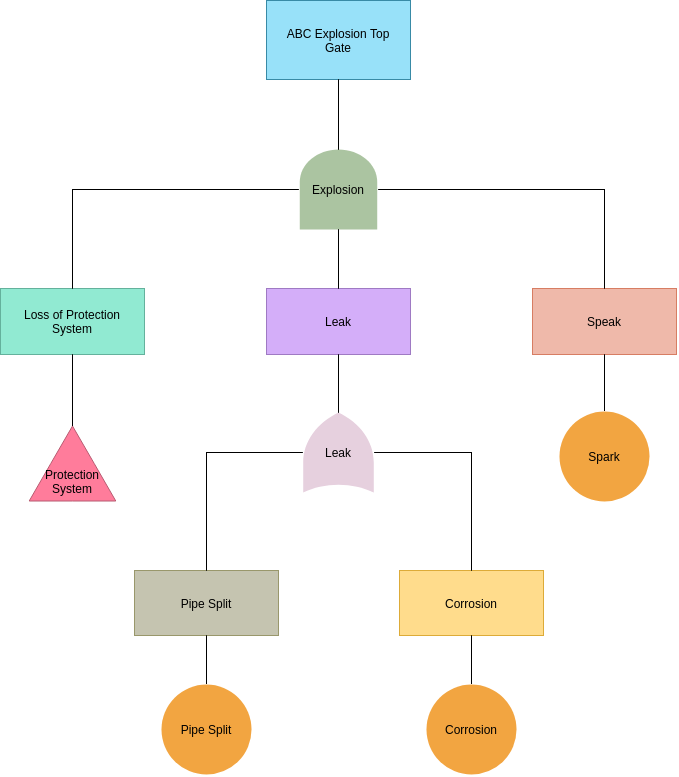
More FTA Examples
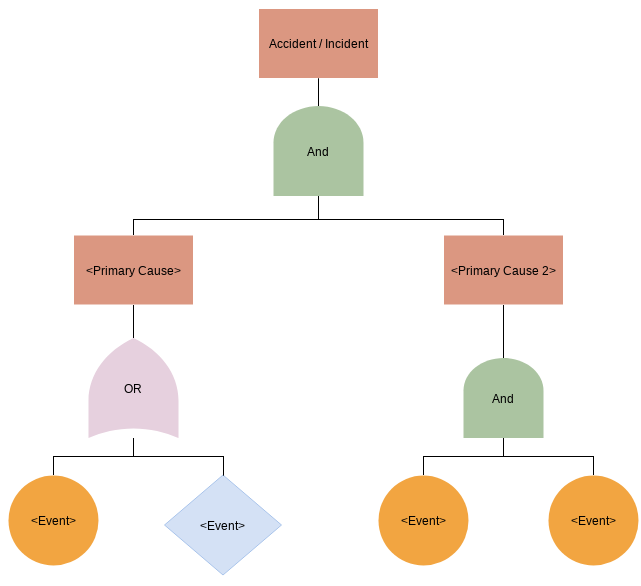
Fault Tree Diagram Illustration
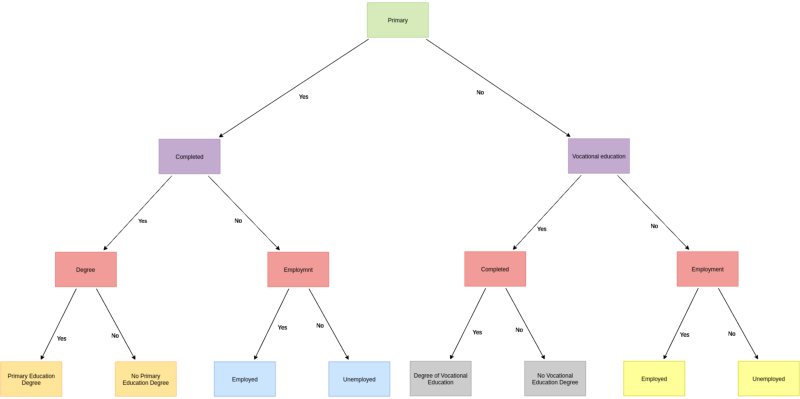
Educational Fault Tree Analysis Example
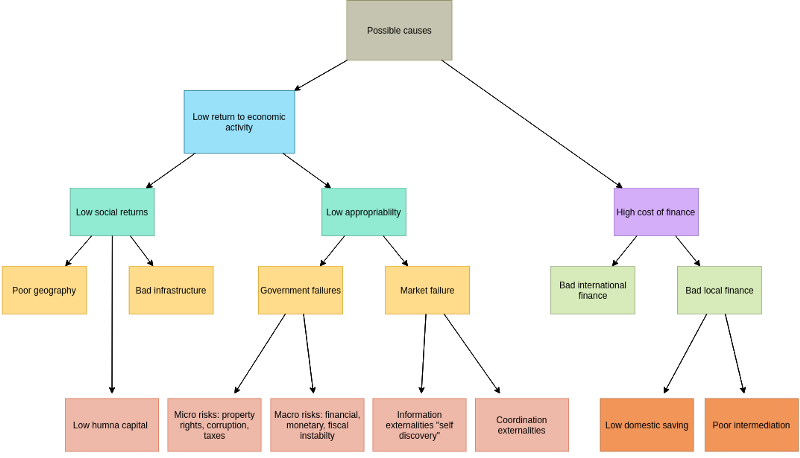
Growth obstacles Fault Tree Analysis
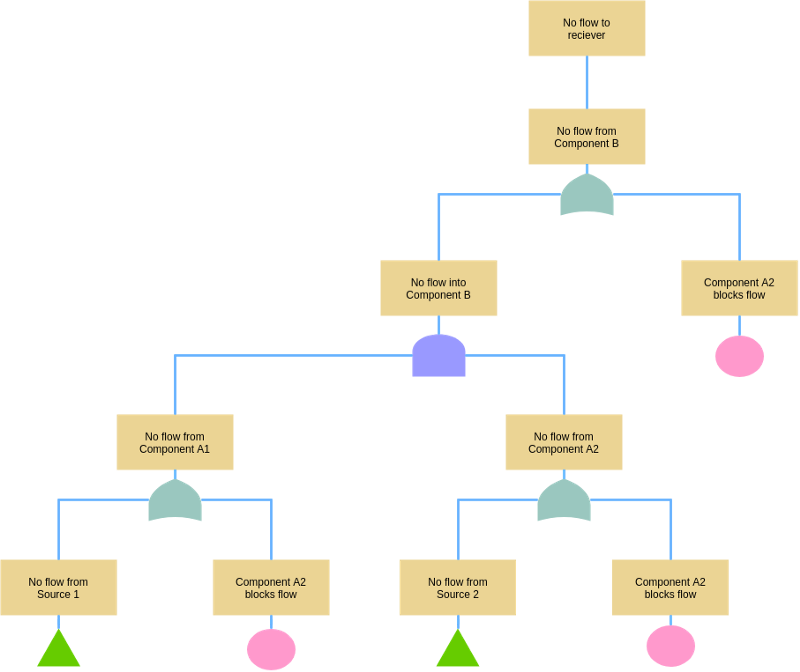
Component Flow Fault Tree Analysis
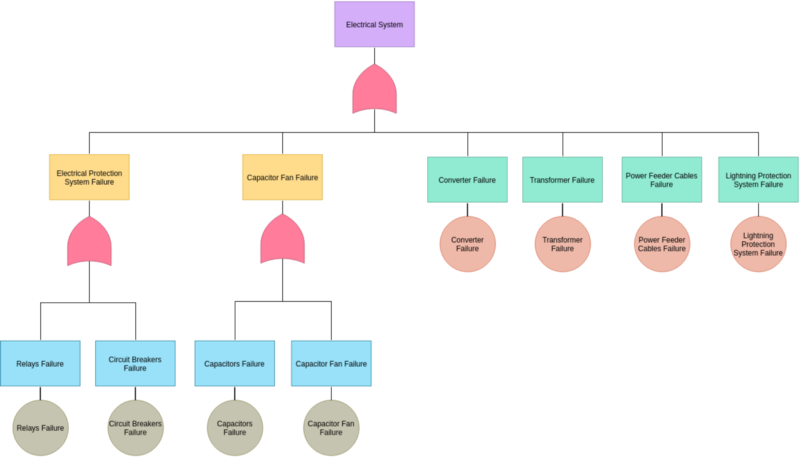
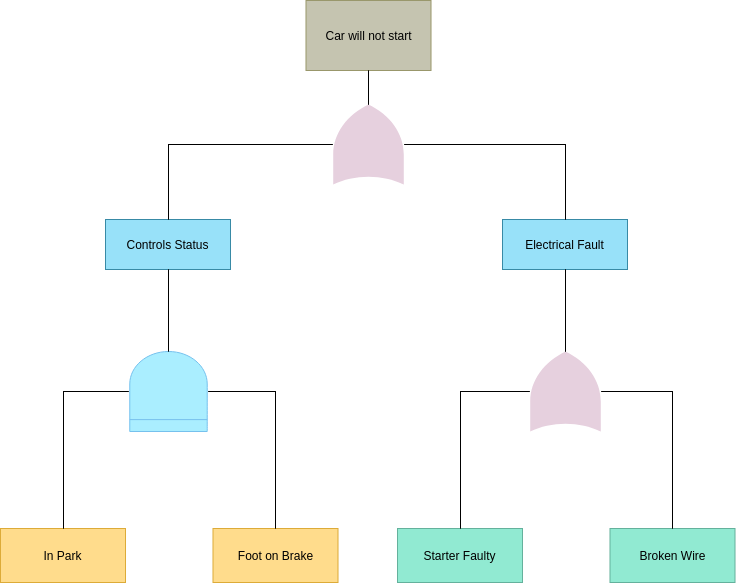
Electrical Fault Tree Analysis
Mid Size Fault Tree Analysis Example
This post is also available in Deutsch, Español, فارسی, Français, English, Bahasa Indonesia, 日本語, Polski, Portuguese, Ру́сский, Việt Nam, 简体中文 and 繁體中文.