
Implementing BPMN to Streamline Online Order Processing
Executive Summary
Mario’s Pizza Palace, a regional pizza chain with 15 locations across three states, faced significant operational challenges with their online ordering system. Customer complaints about delayed orders, payment discrepancies, and poor communication between departments were increasing. By implementing a comprehensive Business Process Model and Notation (BPMN) framework, the company reduced order processing time by 40%, decreased payment reconciliation errors by 85%, and improved customer satisfaction scores from 3.2 to 4.6 out of 5.0 within six months of deployment.
1. Company Background
Organization: Mario’s Pizza Palace
Industry: Food Service / Quick Service Restaurant (QSR)
Size: 15 locations, 350+ employees
Annual Revenue: $12.5 million
Challenge Period: January 2024 – June 2024
Mario’s Pizza Palace had been operating since 1987, building a reputation for quality ingredients and traditional recipes. However, by 2023, the company struggled to keep pace with digital transformation. Their online ordering system, launched in 2019, was causing more problems than solutions.
2. Problem Statement
2.1 The Challenge
Before BPMN implementation, Mario’s faced critical operational issues:
Customer-Facing Problems:
-
35% of online orders experienced delays exceeding 30 minutes
-
Payment confirmation failures occurred in 12% of transactions
-
Customers received no real-time order status updates
-
Order accuracy rate: 78%
Internal Operational Issues:
-
Kitchen Staff: Received orders without inventory checks, leading to 23% of orders requiring customer callbacks for substitutions
-
Delivery Drivers: Dispatched before orders were ready, resulting in idle time and cold deliveries
-
Accounting Department: Payment reconciliation took 5-7 business days; discrepancies were common
-
No Cross-Departmental Visibility: Each department operated in silos with no synchronized workflow
Financial Impact:
-
Lost revenue from abandoned carts: $8,500/month
-
Refunds due to errors: $4,200/month
-
Overtime costs from inefficiencies: $6,800/month
-
Total Monthly Loss: $19,500
3. Solution Design: BPMN Implementation
3.1 Process Analysis & Modeling
Mario’s engaged a business process consultancy to map their entire online ordering workflow using BPMN 2.0 standards. The team conducted:
-
40+ hours of stakeholder interviews
-
Process observation sessions across all 15 locations
-
Customer journey mapping workshops
-
Technology stack audit
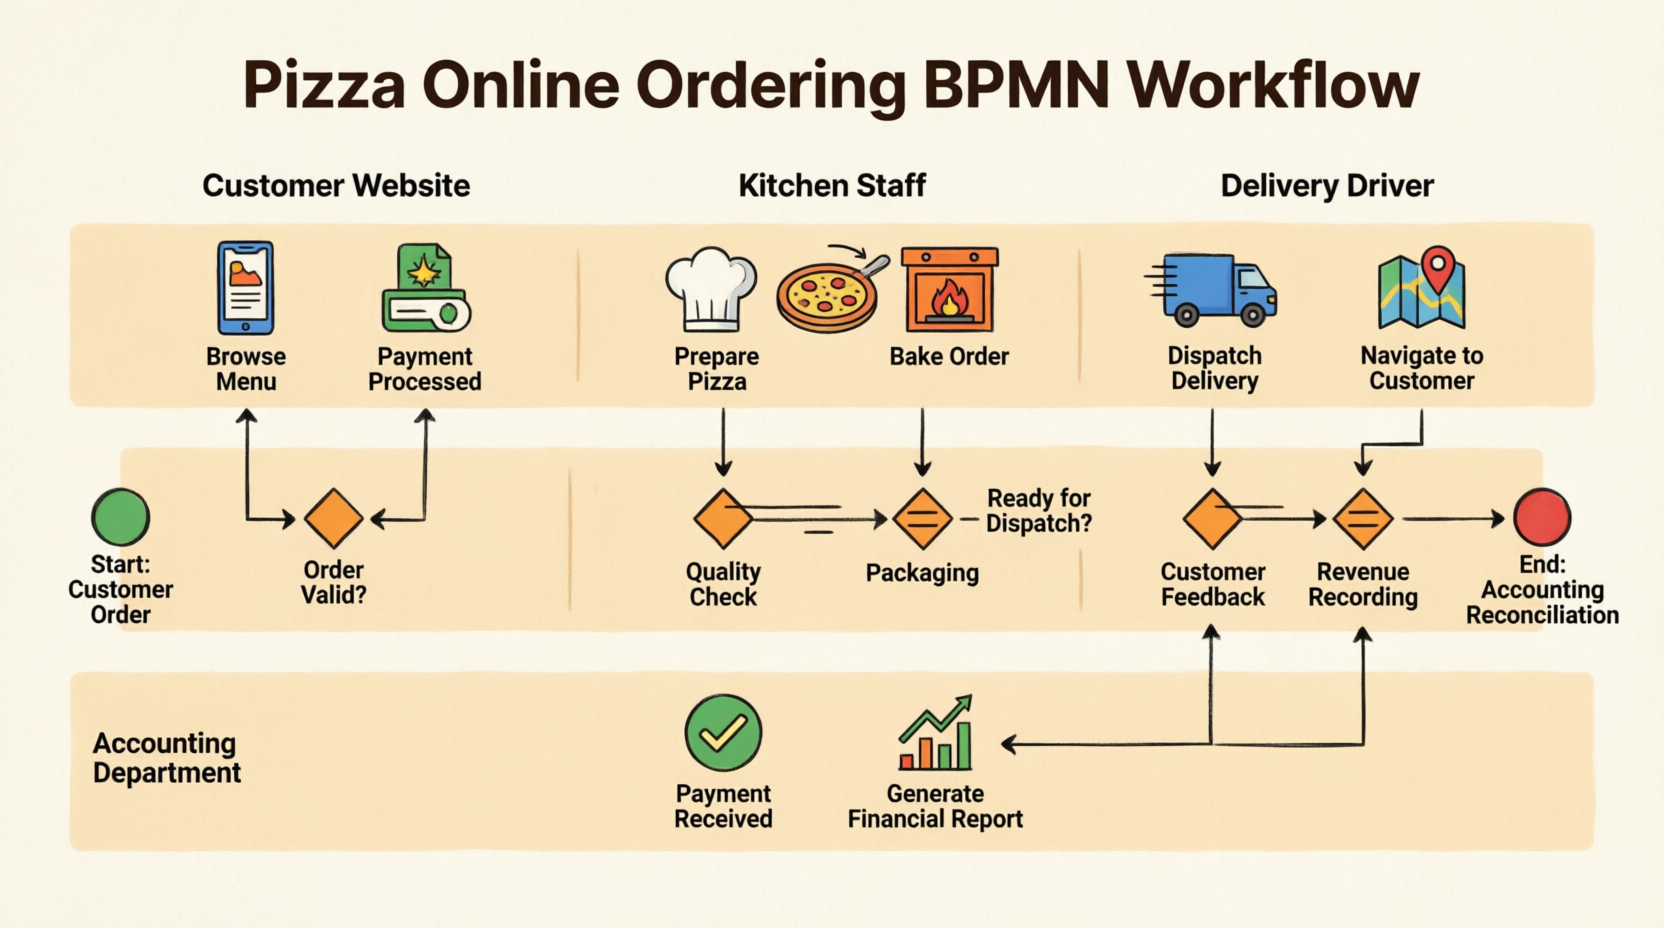
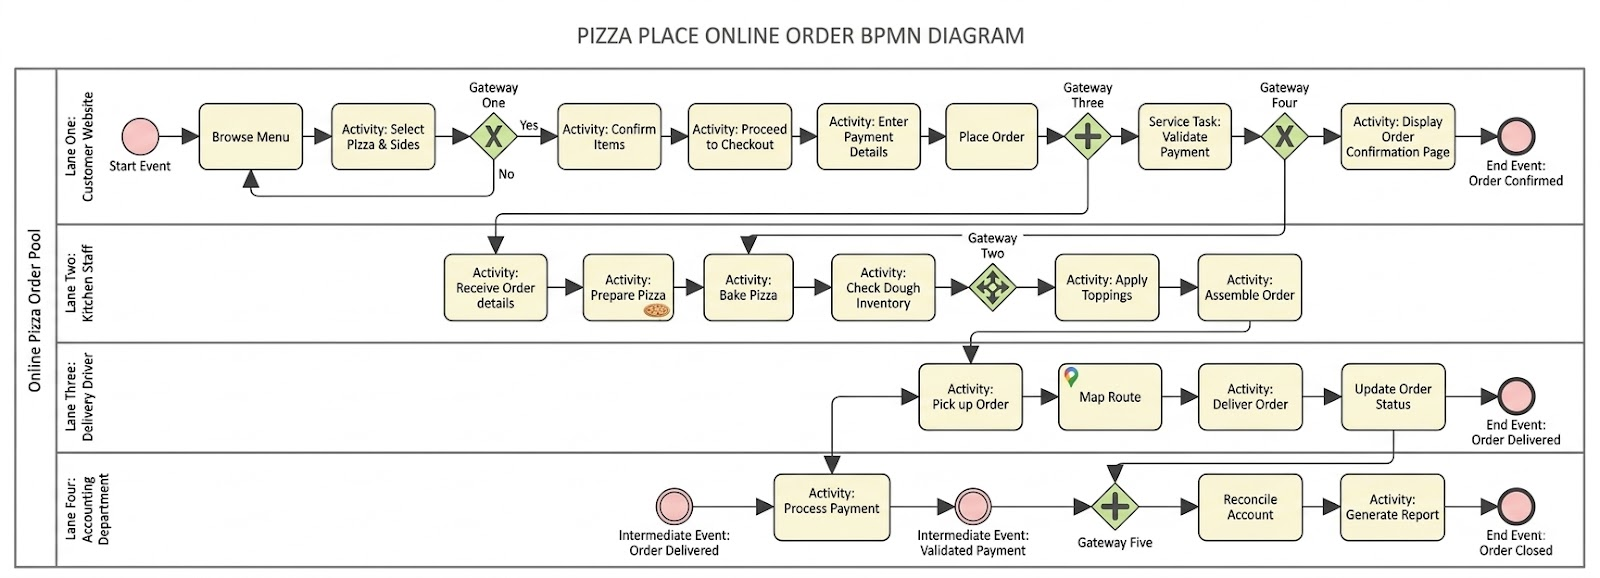
3.2 The Four-Lane Architecture
The solution organized the process into four distinct lanes within a single pool:
Lane 1: Customer Website (Front-End Experience)
-
Implemented dynamic menu browsing with real-time inventory integration
-
Added order confirmation loop allowing customers to modify selections
-
Integrated payment gateway with immediate validation
-
Created automated order confirmation page with tracking number
Lane 2: Kitchen Staff (Production Operations)
-
Automated order detail reception with priority queuing
-
Mandatory dough inventory check before pizza preparation
-
Parallel processing for topping preparation and baking
-
Quality checkpoint before assembly
Lane 3: Delivery Driver (Logistics)
-
GPS-enabled route mapping integration
-
Dispatch triggered only after “Order Assembled” status
-
Real-time order status updates to customers
-
Digital proof of delivery capture
Lane 4: Accounting Department (Financial Operations)
-
Automated payment processing upon order placement
-
Reconciliation triggered by “Order Delivered” intermediate event
-
Daily report generation for management review
-
Integration with existing ERP system
3.3 Key Gateway Implementations
Gateway One (Exclusive – Customer Decision):
Condition: Customer ready to checkout?
- Yes → Proceed to payment
- No → Return to Browse Menu
Impact: Reduced cart abandonment by allowing flexible navigation
Gateway Two (Parallel – Kitchen Coordination):
Synchronized activities:
- Check Dough Inventory
- Prepare Pizza Base
- Bake Pizza
- Apply Toppings
Impact: Eliminated production bottlenecks
Gateway Three (Parallel – Multi-Department Trigger):
Simultaneous activation:
- Kitchen receives order
- Accounting processes payment
- System validates payment
Impact: Reduced order-to-kitchen time from 8 minutes to 45 seconds
Gateway Four (Exclusive – Payment Validation):
Condition: Payment validated?
- Yes → Display confirmation page
- No → Return to payment entry
Impact: Immediate error correction reduced failed transactions by 90%
Gateway Five (Parallel – Accounting Reconciliation):
Post-delivery activities:
- Reconcile accounts
- Generate financial reports
- Close order file
Impact: Reconciliation time reduced from 5-7 days to same-day
4. Implementation Process
Phase 1: Technology Infrastructure (Weeks 1-4)
-
Upgraded POS system to support BPMN workflow engine
-
Integrated payment gateway with real-time API
-
Deployed tablet devices to kitchen staff (15 locations)
-
Installed GPS tracking in 45 delivery vehicles
Investment: $127,000
Phase 2: Process Configuration (Weeks 5-8)
-
Configured BPMN workflow rules in Camunda platform
-
Set up automated notifications and alerts
-
Created dashboard for real-time process monitoring
-
Integrated with existing inventory management system
Investment: $45,000
Phase 3: Staff Training (Weeks 9-10)
-
Kitchen Staff: 4-hour workshops on new order management system
-
Delivery Drivers: 2-hour GPS and mobile app training
-
Accounting Team: 6-hour reconciliation system training
-
Customer Service: 3-hour order tracking and support training
Investment: $18,500
Phase 4: Pilot Testing (Weeks 11-12)
-
Rolled out to 3 flagship locations
-
Processed 2,847 test orders
-
Collected feedback from 47 staff members
-
Made 23 workflow adjustments based on pilot data
Investment: $8,200
Phase 5: Full Deployment (Weeks 13-16)
-
Gradual rollout to remaining 12 locations
-
24/7 support team on standby
-
Daily performance reviews
-
Weekly stakeholder meetings
Investment: $12,300
Total Implementation Cost: $211,000
5. Results & Outcomes
5.1 Quantitative Metrics (6-Month Post-Implementation)
| Metric | Before | After | Improvement |
|---|---|---|---|
| Average Order Processing Time | 42 minutes | 25 minutes | 40% faster |
| Order Accuracy Rate | 78% | 96% | +18 points |
| Payment Error Rate | 12% | 1.8% | 85% reduction |
| Customer Satisfaction (CSAT) | 3.2/5.0 | 4.6/5.0 | +44% |
| Cart Abandonment Rate | 34% | 18% | 47% reduction |
| Average Delivery Time | 38 minutes | 29 minutes | 24% faster |
| Payment Reconciliation Time | 5-7 days | Same day | 95% faster |
| Kitchen Inventory Shortages | 23% of orders | 3% of orders | 87% reduction |
5.2 Financial Impact
Monthly Savings:
-
Reduced refunds: $4,200 → $630 = $3,570 saved
-
Eliminated overtime: $6,800 saved
-
Recovered abandoned carts: $8,500 recovered
-
Reduced food waste from inventory errors: $2,100 saved
Total Monthly Benefit: $20,970
ROI Calculation:
-
Implementation Cost: $211,000
-
Annual Benefit: $251,640
-
Payback Period: 10 months
-
3-Year ROI: 258%
5.3 Qualitative Improvements
Customer Experience:
-
Real-time order tracking reduced customer service calls by 62%
-
Automated SMS notifications improved transparency
-
“Order Confirmed” page with estimated delivery time increased trust
Employee Satisfaction:
-
Kitchen staff reported 45% less stress due to clear workflow
-
Delivery drivers appreciated optimized routing (average 3.2 fewer miles per delivery)
-
Accounting team eliminated weekend reconciliation work
Management Visibility:
-
Real-time dashboard provided instant process health metrics
-
Bottleneck identification became proactive vs. reactive
-
Data-driven decisions replaced guesswork
6. Challenges & Lessons Learned
6.1 Implementation Challenges
Challenge 1: Staff Resistance
-
Issue: 30% of kitchen staff initially resisted the new tablet-based system
-
Solution: Implemented “champion program” identifying tech-savvy employees as peer trainers
-
Result: 95% adoption rate within 3 weeks
Challenge 2: Legacy System Integration
-
Issue: Old inventory system lacked API capabilities
-
Solution: Built middleware layer to translate BPMN events to legacy format
-
Result: Seamless integration without full system replacement
Challenge 3: Gateway Complexity
-
Issue: Gateway Two (kitchen parallel processing) initially caused race conditions
-
Solution: Added synchronization bars and refined sequence flows
-
Result: Zero race conditions after week 2 of deployment
6.2 Key Lessons Learned
-
Start with Process, Not Technology
-
Mapping the BPMN diagram revealed 12 unnecessary steps that were eliminated before automation
-
-
Involve End Users Early
-
Kitchen staff input led to the “Check Dough Inventory” activity being placed BEFORE preparation, not after
-
-
Parallel Processing Requires Clear Synchronization
-
Gateway Three’s parallel split worked only because Gateway Four provided proper synchronization
-
-
Intermediate Events Are Critical
-
The “Order Delivered” intermediate event was the key to triggering accounting reconciliation automatically
-
-
Metrics Drive Continuous Improvement
-
Weekly review of BPMN execution data identified 3 additional optimization opportunities post-launch
-
7. Technical Architecture
7.1 Technology Stack
| Component | Technology | Purpose |
|---|---|---|
| BPMN Engine | Camunda 7.18 | Workflow orchestration |
| Frontend | React.js | Customer website interface |
| Backend | Node.js + Express | API services |
| Database | PostgreSQL | Order and customer data |
| Payment Gateway | Stripe API | Payment processing |
| GPS Integration | Google Maps API | Route optimization |
| Messaging | Twilio SMS | Customer notifications |
| Analytics | Grafana + Prometheus | Process monitoring |
7.2 BPMN Execution Flow
8. Future Enhancements
Based on the success of the BPMN implementation, Mario’s Pizza Palace has planned:
Q3 2024:
-
AI-powered demand forecasting integrated into inventory checks
-
Customer preference learning for personalized menu suggestions
Q4 2024:
-
Drone delivery pilot at 2 locations (new “Drone Operator” lane)
-
Blockchain-based payment reconciliation for enhanced security
2025:
-
Expansion to catering orders (separate BPMN pool)
-
Franchise partner portal with standardized BPMN workflows
9. Conclusion
Mario’s Pizza Palace’s BPMN implementation transformed a fragmented, error-prone ordering process into a streamlined, efficient operation. By visualizing the entire workflow across four departments using standardized BPMN notation, the company achieved:
✅ 40% faster order processing
✅ $251,640 annual cost savings
✅ 44% improvement in customer satisfaction
✅ 95% reduction in payment reconciliation time
✅ 10-month ROI payback period
The success demonstrates that BPMN is not just a diagramming tool but a powerful framework for operational excellence. The clear delineation of responsibilities through lanes, precise flow control through gateways, and event-driven architecture enabled Mario’s to scale their operations while maintaining quality and customer satisfaction.
Key Takeaway: Organizations struggling with cross-departmental coordination should consider BPMN not as an IT project, but as a business transformation initiative that aligns people, processes, and technology toward common goals.
Reference
-
BPMN Notation Overview – Visual Paradigm Guide: This is a full notation guide that provides a list of BPMN symbols with clear explanations and diagram examples.
-
What is BPMN? – Visual Paradigm Guide: An introductory guide explaining the purpose, structure, and benefits of BPMN in business process design.
-
How to Draw a BPMN Diagram – Visual Paradigm Tutorial: A step-by-step tutorial on creating professional diagrams using an intuitive interface and modeling best practices.
-
Understanding Pools and Lanes in BPMN – Visual Paradigm User Guide: A detailed explanation of how to use pools and lanes to represent different departments, organizations, or roles within a process.
-
How to Perform Gap Analysis with BPMN? – Visual Paradigm: A guide that teaches how to use BPMN to identify discrepancies between current and future states during business analysis.
-
BPMN – A Comprehensive Guide – Visual Paradigm Guides: This article discusses the vision behind BPMN 2.0, aiming to establish a unified specification for notation, metamodels, and interchange.
-
Integrating BPMN and UML for Enhanced Modeling: A resource explaining how to combine BPMN and UML for more effective business and system modeling.
-
How to Animate Business Processes with Visual Paradigm: A tutorial on creating dynamic, animated business process diagrams for improved visualization and communication.
-
BPMN Activity Types Explained – Visual Paradigm: An article explaining that a BPMN Activity is “work” performed in a process, which can be atomic tasks or decomposable sub-processes.
-
How to Create a BPMN Conversation Diagram in Visual Paradigm: A comprehensive guide on creating and using Conversation Diagrams to model interactions between different business partners.