
Organizations rely on clear communication to function. When processes become the backbone of operations, visual representation is not just a nice-to-have; it is a critical necessity. Business Process Model and Notation (BPMN) was designed to bridge the gap between business stakeholders and technical implementation teams. Yet, many organizations find themselves stuck with diagrams that confuse more than they clarify. 🧐
If your process maps look like a bowl of spaghetti, or if developers are confused by the logic flows, the issue often lies in the modeling approach rather than the technology. This guide examines the common structural and semantic errors plaguing BPMN models today and provides a clear path toward standardization, clarity, and execution readiness.
🚨 Why Your Diagrams Are Failing
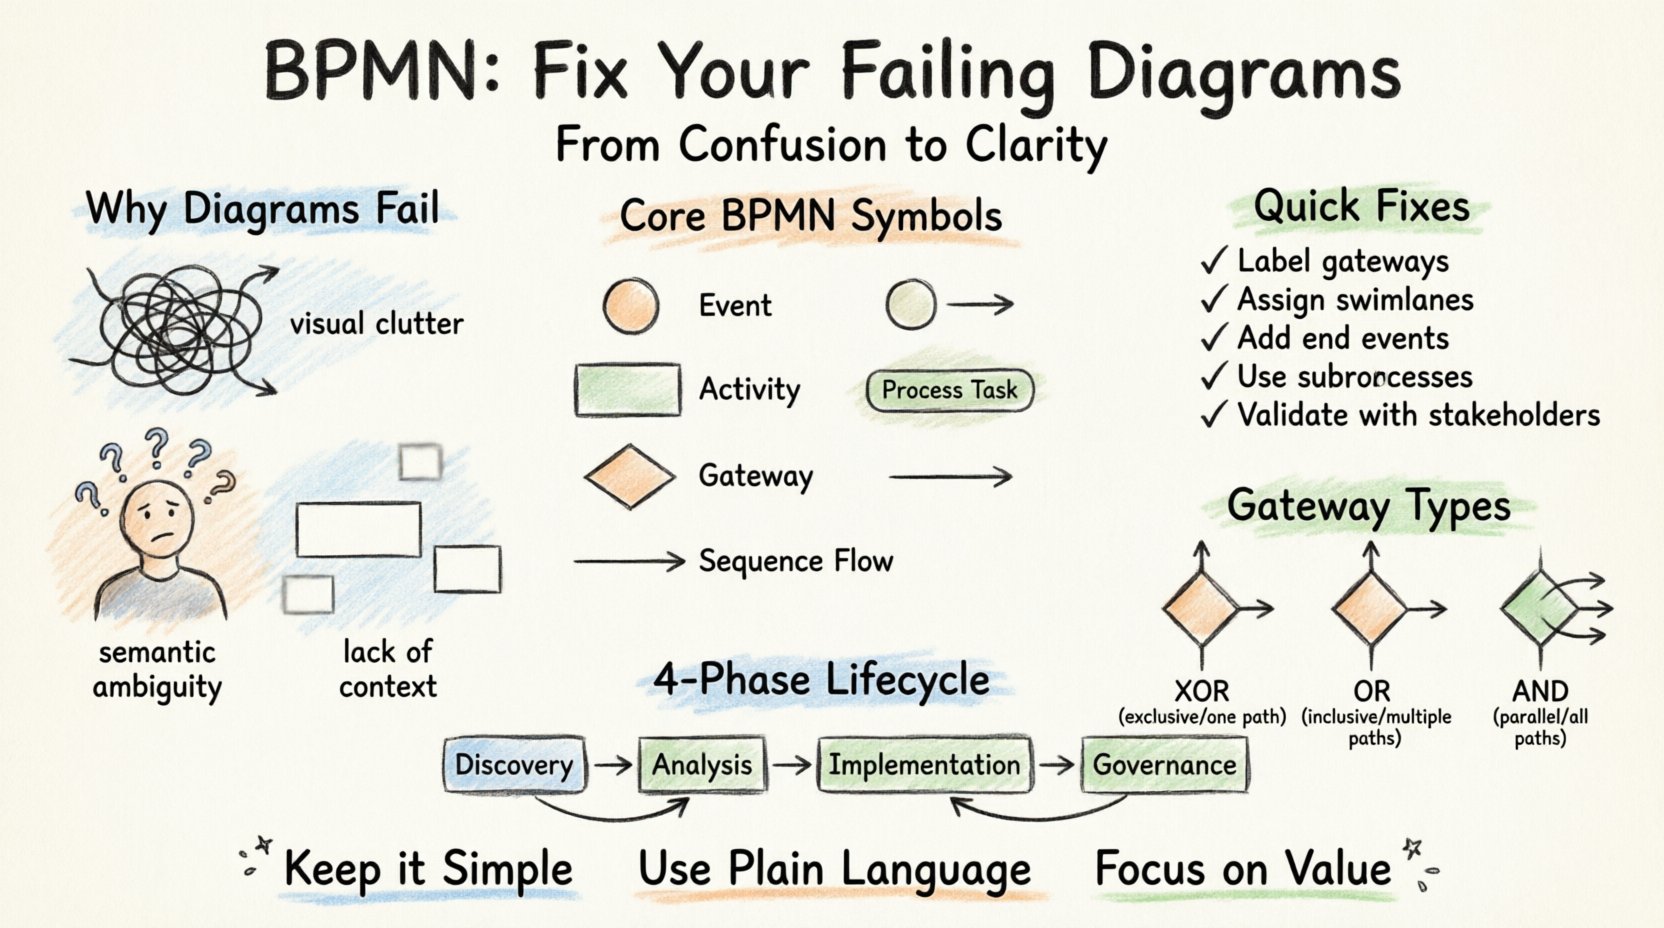
The failure of a process model is rarely about the drawing tool. It is about the adherence to standards and the intent behind the creation. When diagrams fail, it usually manifests in three distinct areas: semantic ambiguity, visual clutter, and lack of context.
1. Semantic Ambiguity
Every shape in BPMN carries a specific meaning. When these shapes are used interchangeably or incorrectly, the model loses its precision. A common mistake is using a generic “Activity” rectangle when a specific task or subprocess is required. This creates confusion regarding the level of detail and the required resources.
- Incorrect: Using a circle for “Start” when a thick boundary is needed.
- Incorrect: Using a diamond for logic when a gateway is required.
- Result: Stakeholders cannot determine the exact steps or decision points required.
2. Visual Clutter
A process map should guide the eye, not overwhelm it. When a single diagram attempts to cover an entire enterprise function, it becomes unreadable. Crossing lines, overlapping elements, and inconsistent alignment destroy the cognitive flow of the reader.
3. Lack of Context
Diagrams often exist in a vacuum. Without defined roles, systems, or data inputs, a flowchart is just a series of boxes. A robust model must account for the “who,” “what,” and “where” of the process.
🛠️ Core Principles of Effective BPMN
To fix failing diagrams, you must return to the foundational elements. BPMN is not merely drawing; it is a formal language. Here are the core principles that ensure a model is robust and maintainable.
Standardization of Symbols
Consistency is key. Ensure that every modeler in your organization uses the same set of symbols for the same actions. This reduces training time and minimizes misinterpretation.
- Events: Represented by circles. They indicate the start, middle, or end of a process.
- Activities: Represented by rounded rectangles. These are the tasks performed.
- Gateways: Represented by diamonds. These control the flow of the process (decision points).
- Sequence Flows: Arrows connecting the elements. They define the order of execution.
Separation of Concerns
Do not mix different levels of abstraction. A high-level overview should not contain the minute details of a specific task. Use sub-processes to hide complexity where it is not immediately relevant.
📊 Common Pitfalls and Fixes
The following table outlines common errors found in enterprise process modeling and provides the corrective action required to align with industry standards.
| Pitfall | Consequence | Corrective Action |
|---|---|---|
| Disconnected Flows | Process logic is broken; execution fails. | Ensure every gateway has an incoming and outgoing sequence flow. |
| Overlapping Swimlanes | Roles are ambiguous; accountability is lost. | Assign clear ownership to each lane. Use Pools for distinct organizations or systems. |
| Unlabeled Gateways | Logic is unclear; decisions are guessed. | Label all gateways with the condition (e.g., “Approved? Yes/No”). |
| Missing End Events | Process appears to run forever. | Every path must terminate at a valid End Event. |
| Complex Logic in One Box | Diagram becomes unmanageable. | Expand complex tasks into Sub-Processes. |
🔄 The Lifecycle of a Process Model
Creating a diagram is only the first step. A failing model often lacks a maintenance lifecycle. Processes change, and if the model does not evolve, it becomes obsolete.
Phase 1: Discovery and As-Is Modeling
The goal here is accuracy. Interview stakeholders to understand the current reality. Document exceptions and workarounds. Do not clean up the process yet; capture the truth.
- Use informal notes alongside the diagram to capture exceptions.
- Validate the model with the people performing the work.
Phase 2: Analysis and To-Be Modeling
Once the As-Is is documented, analyze for bottlenecks and redundancies. Design the To-Be state. This is where optimization happens. Focus on removing non-value-added steps.
Phase 3: Implementation and Execution
The model must be executable. This means the logic must be translatable into automation or standard operating procedures. Avoid human-readable descriptions in the flow; use clear, binary conditions.
Phase 4: Monitoring and Governance
Establish a governance framework. Who approves changes? When is the model reviewed? Without governance, the model drifts away from reality.
🧩 Advanced Modeling Techniques
To move from basic diagrams to professional-grade models, consider these advanced techniques.
Swimlanes and Pools
Swimlanes define responsibility. Pools define boundaries. A single Pool represents an organization or a system. Multiple Pools indicate interactions between different entities. Misusing these leads to unclear handoffs.
- Pool: Represents a major participant (e.g., Customer, Vendor).
- Lane: Represents a specific role or department within the Pool (e.g., Finance, Sales).
Intermediate Events
Processes rarely start and end in a vacuum. Intermediate events capture the reality of waiting, messaging, or errors. They are crucial for understanding latency.
- Message Events: Communication between pools.
- Timer Events: Delays or scheduled triggers.
- Error Events: Handling exceptions within a subprocess.
Transaction Sub-processes
Some operations must succeed entirely or fail entirely. A Transaction Sub-process ensures that if any step fails, the entire group rolls back. This is vital for financial or data integrity processes.
🎨 Visual Best Practices
Even with perfect logic, a diagram can fail if it is visually poor. Readability is a functional requirement, not an aesthetic one.
- Directional Flow: Generally, flow should be top-to-bottom or left-to-right. Avoid crossing lines.
- Consistent Spacing: Equal spacing between elements reduces visual noise.
- Color Usage: Use color sparingly. Use it to highlight exceptions or status, not to decorate.
- Annotation: Use text annotations for requirements that cannot be modeled (e.g., “Must comply with regulation X”).
🛡️ Governance and Maintenance
A model is a living document. Without governance, it becomes a relic. Implement a review cycle.
Version Control
Every change to a model should be versioned. This allows you to track how a process evolved over time and revert changes if necessary.
Access Control
Not everyone should be able to edit the model. Define roles for Modelers, Reviewers, and Viewers. This prevents accidental corruption of the process logic.
Documentation
The diagram is not the only documentation. Maintain a glossary of terms, a list of roles, and a set of business rules associated with the model.
🚀 Moving from Analysis to Execution
The ultimate goal of BPMN is often to drive execution. Whether this is manual execution by staff or automation by a workflow engine, the model must be precise.
Data Objects
Processes manipulate data. Ensure you represent data objects explicitly. This helps developers understand what information is passed between tasks.
Business Rules
Decisions in a process are driven by rules. Instead of hardcoding logic into the diagram, externalize these rules where possible. This makes the model more flexible.
Integration Points
Modern processes rarely exist in isolation. Clearly mark where the process interacts with external systems. Use Message Events for these interactions to denote asynchronous communication.
📝 Summary of Actionable Steps
To ensure your diagrams succeed, follow this checklist:
- Review Symbols: Are you using the correct BPMN 2.0 shapes?
- Check Logic: Do all paths lead to an End Event?
- Assign Roles: Are all tasks assigned to a specific lane?
- Label Gateways: Is every decision point clearly labeled?
- Validate: Have stakeholders reviewed and signed off on the model?
- Maintain: Is there a schedule for updating the model?
🔍 Deep Dive: The Gateway Trap
One of the most frequent sources of failure is the misuse of Gateways. Gateways control the branching of the process. Using the wrong type of gateway changes the meaning of the flow entirely.
Exclusive Gateway (XOR)
Only one path out of many is taken. This is the standard decision diamond. Use this for “Yes/No” scenarios.
Inclusive Gateway (OR)
One or more paths out of many are taken. Use this when multiple conditions can be true simultaneously.
Parallel Gateway (AND)
All paths are taken at once. This represents a split in work, such as “Notify HR” AND “Notify IT” simultaneously.
Merging Gateways
Ensure that every split has a corresponding merge. If you split into two paths, you must merge them back before proceeding, unless the process ends.
🌐 The Human Element
Finally, remember that BPMN is a tool for communication. If the diagram is technically perfect but the people cannot understand it, it has failed. The modeler must act as a translator between business needs and technical requirements.
- Keep it Simple: If a stakeholder cannot explain the diagram back to you, simplify it.
- Use Plain Language: Labels should be action-oriented (e.g., “Approve Request” not “Request Approval Task”).
- Focus on Value: Highlight where value is created. Remove steps that add no value.
🏁 Conclusion on Model Quality
High-quality process modeling requires discipline, adherence to standards, and a willingness to refactor. It is not a one-time task but a continuous improvement cycle. By addressing the semantic errors, visual clutter, and governance gaps identified in this guide, you can transform your diagrams from sources of confusion into powerful assets for organizational efficiency.
Start by auditing your current models against the pitfalls listed above. Implement the governance structures necessary to maintain them. And always prioritize clarity over complexity. A simple, accurate diagram is worth more than a complex, perfect one.