


Transforming complex business processes into clear, actionable insights is the cornerstone of operational excellence. The AI-Powered Value Stream Mapping Editor by Visual Paradigm offers a revolutionary approach to this challenge, enabling professionals to visualize, analyze, and optimize workflows with unprecedented speed and accuracy. This tutorial demonstrates how to leverage this powerful tool to create a comprehensive value stream map, starting from a simple problem description and culminating in an AI-generated report with strategic recommendations. By following these steps, you can gain a holistic view of your process, identify hidden waste, and make data-driven decisions to enhance efficiency. This guide will walk you through the entire workflow, from initial setup to the final executive report, showcasing the power of intelligent mapping.
Key Takeaways
-
Use AI-Guided Flow Detection to automatically generate a value stream map from a textual process description.
-
Utilize the split-pane editor to see process data and the corresponding diagram update in real-time.
-
Apply AI Analysis to generate a professional report with actionable insights and improvement suggestions.
-
Export the final map as a high-quality PNG for presentations and stakeholder communication.
Getting Started with the AI-Powered Value Stream Mapping Editor
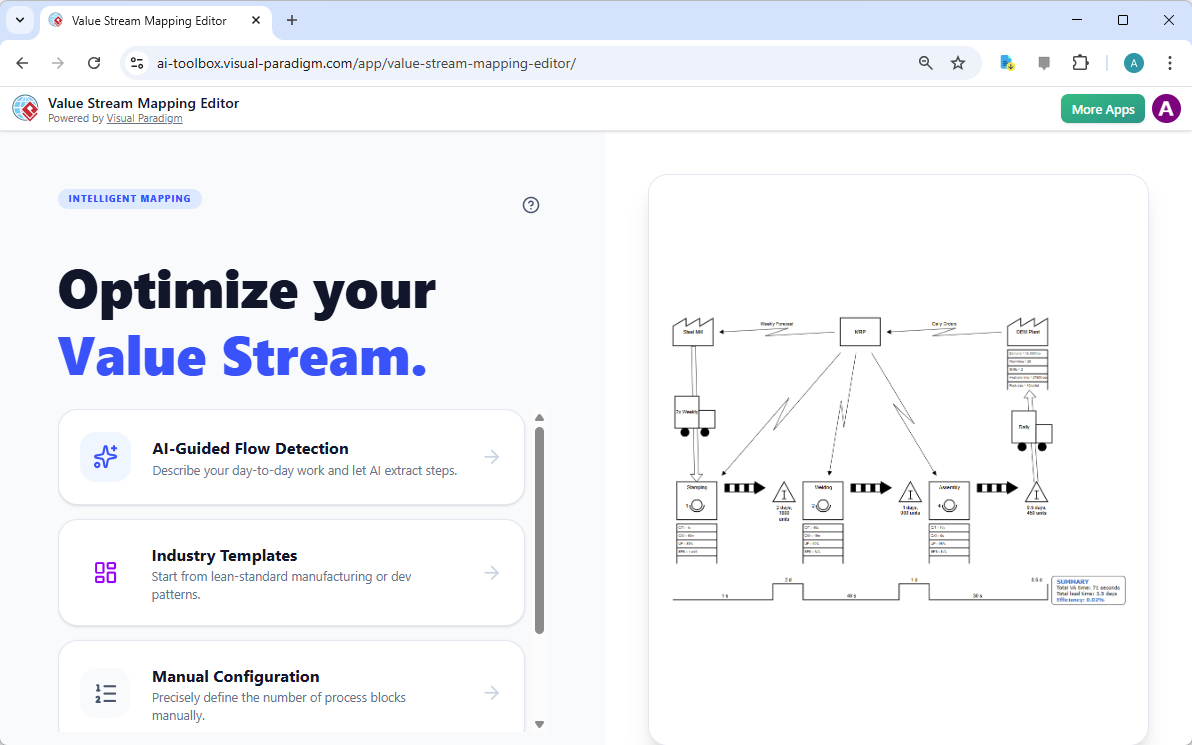
The journey begins with the intuitive main interface of the Value Stream Mapping Editor. This screen presents three distinct entry points, allowing users to choose the most suitable method for their needs. For those who have a clear problem statement but lack a structured process model, the AI-Guided Flow Detection option is ideal. It allows you to describe your day-to-day work, and the AI will extract the core value steps. Alternatively, users can start with a pre-defined template from the Industry Templates section, which provides a lean-standard manufacturing or development pattern as a starting point. For those who prefer a hands-on approach, the Manual Configuration option enables you to precisely define the number of process blocks and customize the diagram manually. The choice depends on the user’s familiarity with the process and their desired level of automation.
Generating a Map from a Problem Description
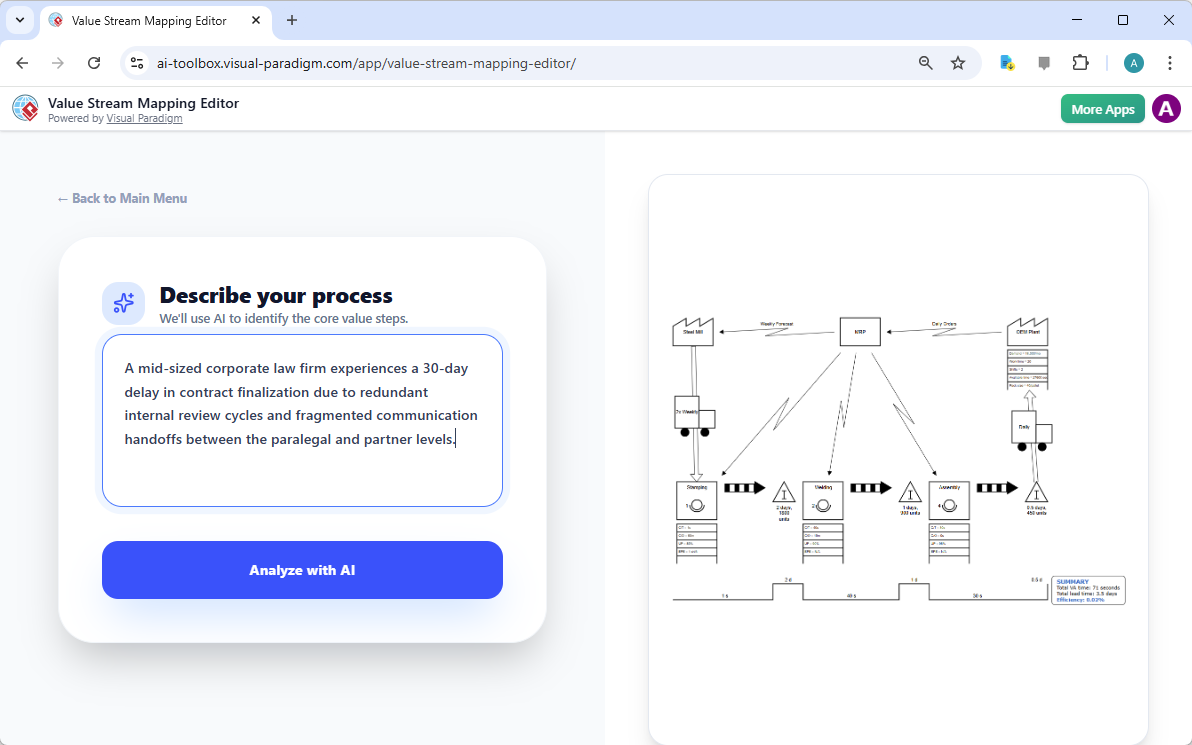
Let’s demonstrate the AI-Guided Flow Detection workflow. The process starts by providing a clear description of the business problem. In this example, the user has input a scenario: “A mid-sized corporate law firm experiences a 30-day delay in contract finalization due to redundant internal review cycles and fragmented communication handoffs between the paralegal and partner levels.” This text serves as the foundation for the AI engine. By clicking the “Analyze with AI” button, the system processes the description, identifies the key activities, and begins to construct a value stream map. The AI interprets the narrative to determine the sequence of events, the roles involved, and the flow of information, creating a preliminary structure that can be refined.
Visualizing the AI-Generated Value Stream Map
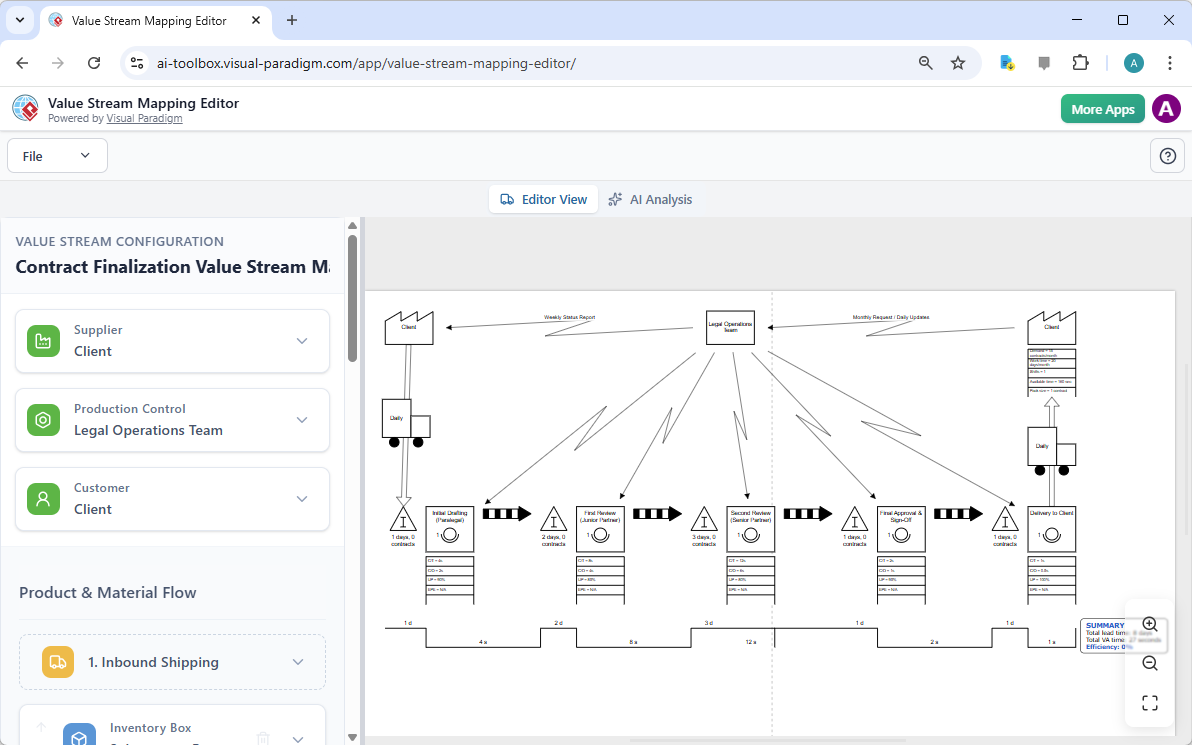
After the AI has analyzed the input, the tool generates a complete value stream map. The resulting diagram, as seen in the image, is a professional, standardized representation of the contract finalization process. It clearly illustrates the flow of work, starting from the initial request, moving through various review stages, and culminating in the final delivery to the client. The map includes standard VSM symbols for suppliers, customers, process steps, and inventory. The left-hand panel, labeled “VALUE STREAM CONFIGURATION,” displays the underlying data structure, which is the foundation for the visual representation. This split-pane view is a critical feature, as it allows users to see the data and the diagram simultaneously, ensuring that any edits to the data are immediately reflected in the visual map.
Examining the Diagram in Detail
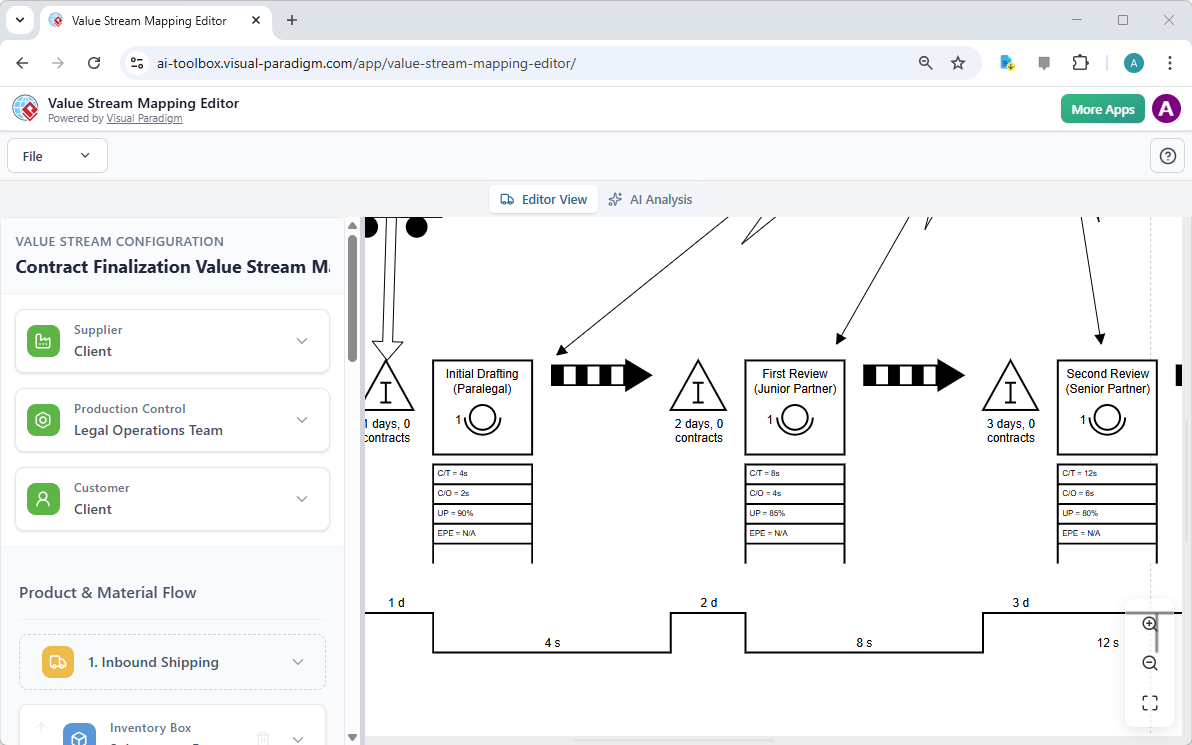
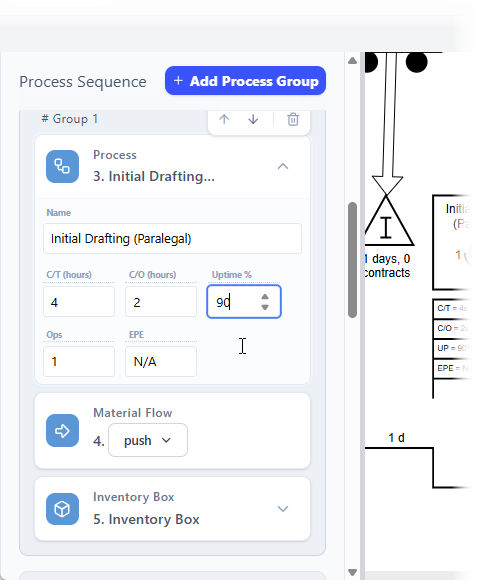
For a deeper understanding of the process, the diagram can be zoomed in to examine specific details. The zoomed view reveals the intricate components of each process step, including the cycle time (CT), changeover time (C/O), uptime (UP), and number of operators (Ops). It also highlights the inventory levels between steps, such as the 1-day wait for the “Initial Drafting” step. This level of detail is crucial for identifying bottlenecks and areas of waste. The visual representation, with its clear timelines and information flows, makes it easy to communicate the process complexity to stakeholders who may not be familiar with the technical details.
Refining the Map with Manual Editing
The true power of the editor lies in its ability to seamlessly transition from automated generation to manual refinement. The configuration pane on the left provides a structured data editor where every element of the value stream can be precisely defined. For instance, the user can edit the “Initial Drafting” process step to change the cycle time from 4 hours to 3 hours, or adjust the uptime percentage. These changes are not just data entries; they are live updates that instantly modify the corresponding diagram on the right. This real-time feedback loop allows for rapid prototyping and simulation of process changes, enabling users to quickly model the impact of proposed improvements without having to redraw the entire diagram.
Unlocking AI-Powered Insights with Analysis
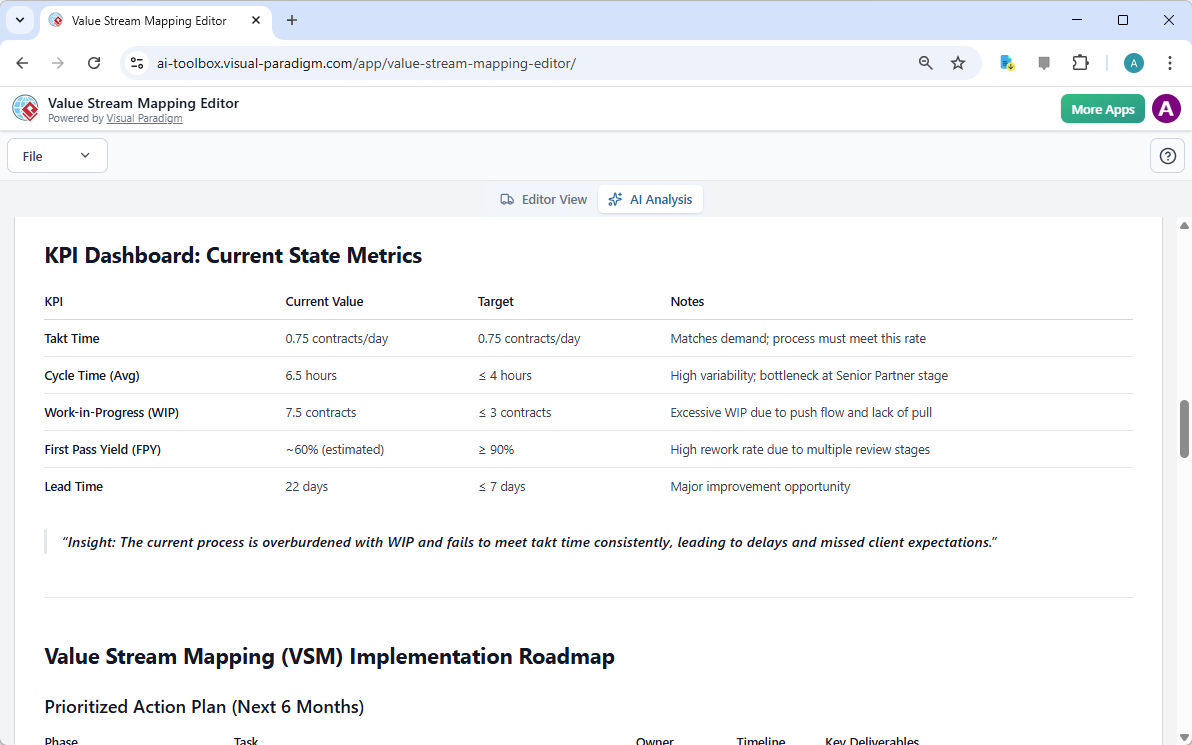
Once the current state map is complete, the next step is to analyze it for actionable insights. The “AI Analysis” tab is where the tool’s intelligence shines. By selecting a report type from the dropdown menu—such as “General Report,” “Quantitative Performance Report,” or “Executive and Strategic Report”—users can generate a comprehensive analysis. The AI engine reviews the entire value stream, calculates key metrics like lead time and process time, and identifies critical bottlenecks and areas of waste. This automated analysis acts as a virtual consultant, providing expert recommendations for process optimization that might be missed during a manual review.

Generating an Executive and Strategic Report
The culmination of the analysis is the generation of a professional report. The “Executive and Strategic Report” provides a high-level overview of the value stream’s performance, highlighting key performance indicators (KPIs) such as Takt Time, Cycle Time, and Lead Time. It also includes a “Summary” section that offers a concise insight into the process’s overall health. For example, the report might state, “The current process is overburdened with WIP and fails to meet takt time consistently, leading to delays and missed client expectations.” This report serves as a powerful communication tool, allowing stakeholders to quickly grasp the current state, understand the challenges, and align on a prioritized action plan for improvement.
Conclusion
The AI-Powered Value Stream Mapping Editor by Visual Paradigm revolutionizes the process of workflow analysis. By combining intuitive AI-guided creation with a powerful, data-driven editor and intelligent analysis, it empowers users to quickly map complex processes, identify inefficiencies, and generate strategic recommendations. The ability to transform a simple problem description into a detailed, shareable diagram with AI-powered insights is a significant leap forward for Lean practitioners, operations managers, and business analysts. This tool is not just a diagramming app; it is a strategic planning platform that accelerates the journey to operational excellence.
Ready to transform your business processes? Try the AI-Powered Value Stream Mapping Editor today and start optimizing your value stream.
Related Links
Value stream mapping (VSM) is a strategic framework used to visualize workflows and identify inefficiencies within a process, ultimately helping teams to eliminate waste and improve value delivery. By mapping end-to-end processes, organizations can track lead times, identify bottlenecks, and align their capabilities with strategic goals.
-
What Is Value Stream Mapping? A Complete Guide: A foundational guide explaining how VSM visualizes workflows to identify and eliminate waste, thereby improving process efficiency.
-
Comprehensive Guide to Value Stream Mapping: This article covers the fundamentals, benefits, and step-by-step procedures for continuous business improvement through mapping.
-
Value Stream Mapping Tool – Visual Paradigm: An overview of a tool designed to help organizations streamline processes and improve operational efficiency through visual analysis.
-
Value Stream Mapping as an Artifact of the Vision Phase: Explores how VSM serves as a key artifact to align teams and define strategic direction during the early phases of product development.
-
How to Use Value Stream Mapping in Six Sigma Projects: Details how VSM reveals process bottlenecks and reduces cycle times to enable data-driven improvements in Six Sigma contexts.
-
Eliminate Waste with Value Stream Mapping: A Practical Approach: A practical guide for identifying and removing the eight types of waste in both manufacturing and service-based environments.
-
Value Stream to Capability Cross-Mapping View in ArchiMate: A specialized template for enterprise architects to map value streams directly to organizational capabilities using the ArchiMate framework.
-
Free Value Stream Mapping Templates: A library of ready-to-use templates designed to accelerate process mapping and help teams uncover improvement opportunities.
-
Value Stream Mapping Software – Visual Paradigm Online: An introduction to cloud-based software for collaborative workflow design and optimization for lean manufacturing.
-
Value Stream Mapping Template for Bottleneck Identification: A professional template used to visualize end-to-end processes and track critical metrics like lead times.
This post is also available in Deutsch, Español, فارسی, Français, English, Bahasa Indonesia, 日本語, Polski, Portuguese, Ру́сский, Việt Nam, 简体中文 and 繁體中文.