


Introduction: Why This Guide Resonates with Real-World Practitioners
As someone who has navigated the tangled webs of enterprise software development for over a decade, I remember the early days of UML modeling with a mix of nostalgia and mild frustration. Diagrams felt like academic exercises—beautiful on paper but disconnected from the messy reality of sprint planning, legacy code, and stakeholder expectations.
That changed when I discovered a more practical, tool-assisted approach to Unified Modeling Language. This guide isn’t just another theoretical textbook. It’s a distilled, experience-driven walkthrough of all 14 UML diagram types, written from the perspective of someone who has actually used these diagrams to ship real products, align cross-functional teams, and prevent costly architectural missteps.
Whether you’re a junior developer trying to understand your team’s architecture documents, a product manager facilitating requirement workshops, or a seasoned architect evaluating modeling tools, this resource meets you where you are. We’ll explore each diagram type through the lens of practical utility: what problem it solves, when it shines, and how modern AI-powered tools like Visual Paradigm can accelerate your workflow without sacrificing precision.
No jargon without explanation. No diagrams without purpose. Just clear, actionable insights you can apply today.
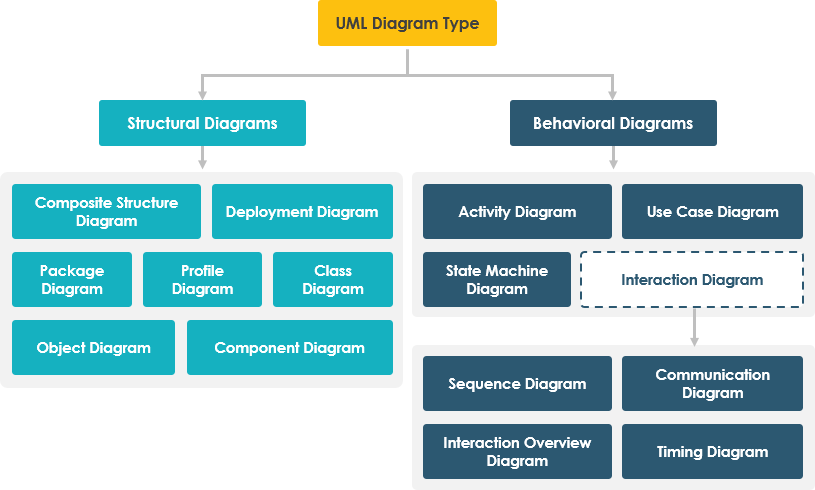
STRUCTURE DIAGRAMS: Mapping the Static Backbone of Your System
Structure diagrams reveal the static architecture of your software—the classes, components, and infrastructure that form its foundation. Think of them as the blueprints before construction begins.
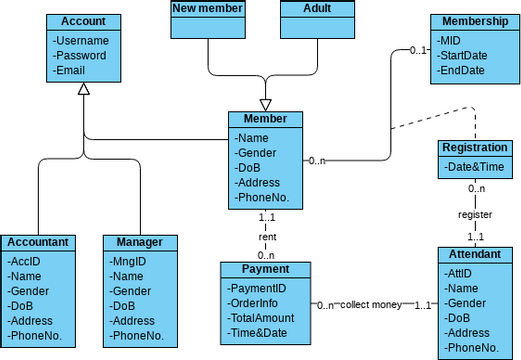
1. Class Diagram
Purpose: The cornerstone of object-oriented design, visualizing classes, their attributes, operations, and relationships.
Key Concepts:
-
Classes: Represent object types with attributes (data) and operations (methods)
-
Relationships:
-
Association: Connections between instances (e.g., “Person works for Company”)
-
Inheritance (Generalization): “Is-a” hierarchies showing class specialization
-
Aggregation: “Has-a” whole-part compositions
-
Multiplicity: Defines instance counts (e.g., 0..*, 1..1)
-
When I Use It:
-
During initial domain modeling and requirements analysis
-
As a living reference while implementing core business logic
-
To onboard new team members to the codebase structure
-
When refactoring to visualize dependency impacts
Pro Tip: Start with a high-level domain model before diving into implementation details. Keep it focused—one diagram per bounded context prevents overwhelming complexity.
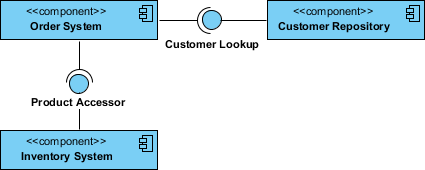
2. Component Diagram
Purpose: Illustrates how modular software components interconnect to form larger systems, clarifying architectural boundaries and dependencies.
Key Concepts:
-
Components: Replaceable, encapsulated units (libraries, services, modules)
-
Interfaces: Contracts defining how components interact (provided/required)
-
Dependencies: Directional relationships showing reliance
-
Ports: Explicit interaction points on component boundaries
-
Connectors: Communication pathways between components
When I Use It:
-
When designing microservices or plugin architectures
-
To document third-party integration points
-
During system decomposition workshops with engineering leads
-
To plan component reuse across projects
Real-World Win: Using component diagrams during a platform migration helped our team identify hidden couplings early, saving weeks of rework.
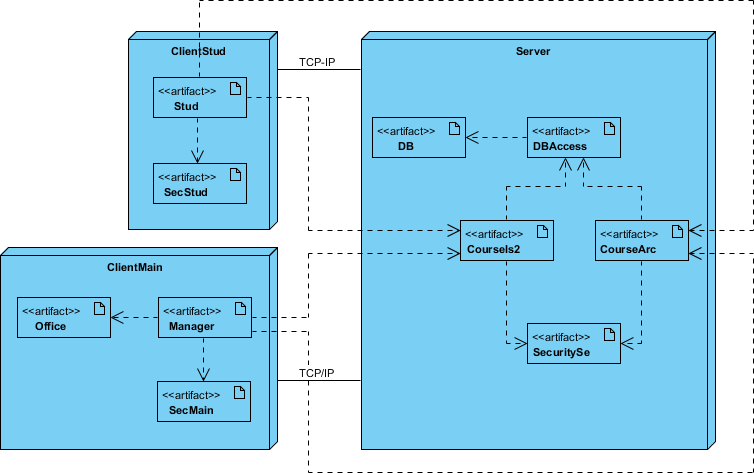
3. Deployment Diagram
Purpose: Models the physical runtime architecture—how software artifacts map to hardware nodes and network infrastructure.
Key Concepts:
-
Nodes: Physical or virtual hardware (servers, containers, edge devices)
-
Artifacts: Deployable units (executables, databases, config files)
-
Communication Associations: Network links and protocols
-
Deployment Specifications: Rules for artifact placement
-
Runtime Configuration: Static view of execution topology
When I Use It:
-
Collaborating with DevOps on infrastructure-as-code planning
-
Documenting multi-environment deployments (dev/stage/prod)
-
Visualizing hybrid cloud or edge computing architectures
-
Troubleshooting distributed system issues
Tool Insight: Modern tools that sync deployment diagrams with actual infrastructure definitions (like Terraform or Kubernetes manifests) bridge the documentation-execution gap beautifully.
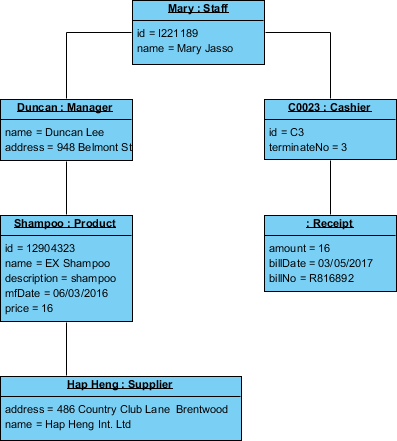
4. Object Diagram
Purpose: Captures a concrete snapshot of object instances and their relationships at a specific moment in time.
Key Concepts:
-
Instances: Concrete objects with actual attribute values
-
Instance Specifications: Named objects showing real data
-
Links: Runtime connections between object instances
-
Snapshot in Time: Represents system state at one moment
-
Concrete vs. Abstract: Shows data, not just type definitions
When I Use It:
-
To illustrate complex data relationships for stakeholder reviews
-
Validating class diagram designs with realistic examples
-
Debugging unexpected object interactions during testing
-
Creating test scenario documentation for QA teams
Key Difference from Class Diagrams: Class diagrams define the template; object diagrams show a specific instance of that template in action.
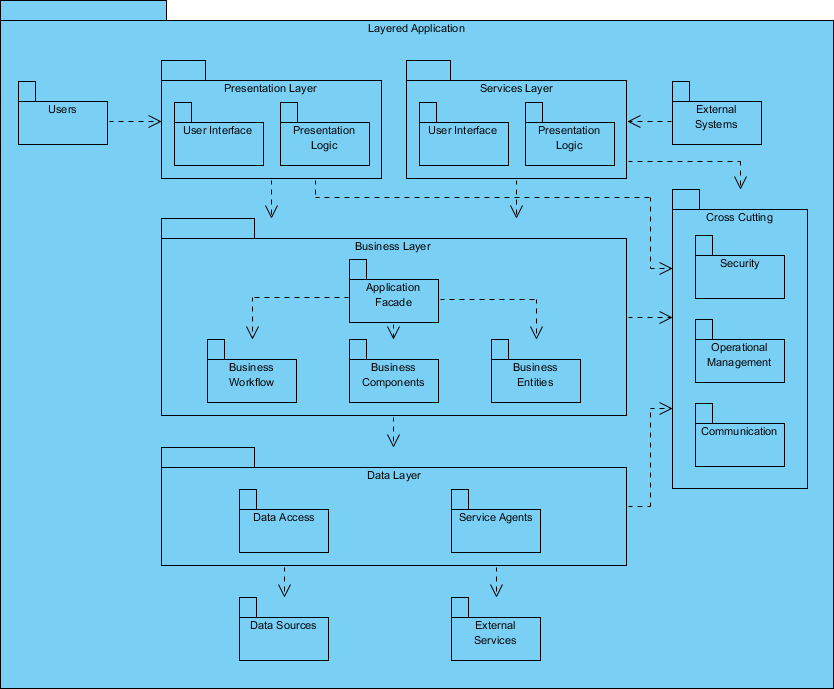
5. Package Diagram
Purpose: Organizes large systems into logical namespaces and visualizes dependencies between modular groups.
Key Concepts:
-
Packages: Containers grouping related classes, interfaces, or sub-packages
-
Dependencies: Directional relationships between packages
-
Package Merging: Combining elements from multiple sources
-
Layered Architecture: Visualizing tiered application structures
-
Namespace Management: Preventing naming conflicts at scale
When I Use It:
-
Structuring monorepos or multi-module projects
-
Communicating architectural layers to new engineers
-
Managing dependency boundaries during refactoring
-
Planning module extraction for microservices migration
Best Practice: Use package diagrams early in enterprise architecture planning—they prevent “spaghetti dependencies” before code is written.
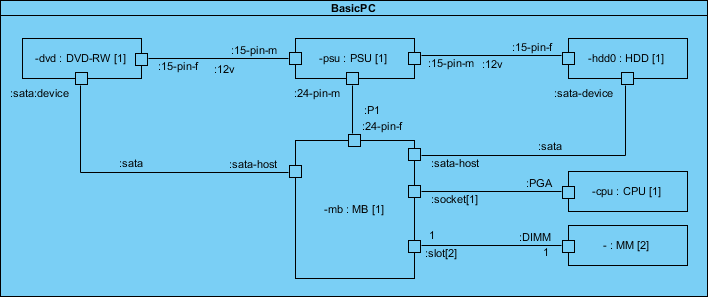
6. Composite Structure Diagram
Purpose: Reveals the internal collaboration of parts, ports, and connectors within a complex class or component.
Key Concepts:
-
Parts: Constituent elements that compose the whole
-
Ports: Defined interaction points for external communication
-
Connectors: Links enabling collaboration between parts
-
Roles: Responsibilities assigned to each element
-
Internal Structure: Micro-level view of classifier composition
When I Use It:
-
Designing complex patterns like Strategy or Observer
-
Documenting framework internals for contributor onboarding
-
Modeling runtime collaborations in event-driven systems
-
Clarifying delegation relationships in layered architectures
Advanced Tip: Combine with sequence diagrams to show both structure and behavior of intricate collaborations.
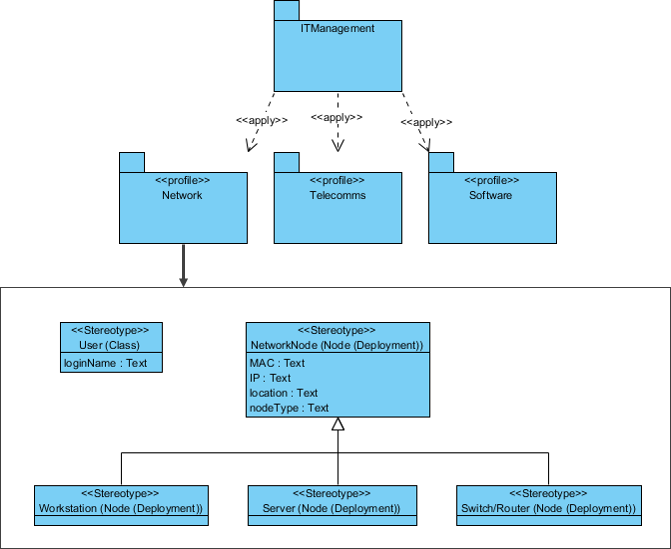
7. Profile Diagram
Purpose: Enables domain-specific extensions to UML through custom stereotypes, tagged values, and constraints.
Key Concepts:
-
Stereotypes: Custom extensions of UML metaclasses for specific domains
-
Tagged Values: Additional metadata attached to stereotypes
-
Metaclasses: Standard UML elements being extended
-
Profiles: Curated collections of stereotypes for a domain
-
Constraints: Rules governing valid stereotype usage
When I Use It:
-
Adapting UML for regulated industries (healthcare, finance)
-
Creating platform-specific modeling conventions (JEE, .NET)
-
Building internal DSLs for domain experts
-
When standard UML notation lacks expressive power
Tool Advantage: AI-powered profile generation can suggest relevant stereotypes based on your domain description, accelerating customization.
BEHAVIOR DIAGRAMS: Capturing Dynamic System Interactions
Behavior diagrams model how your system acts over time—the workflows, state changes, and message exchanges that bring static structures to life.
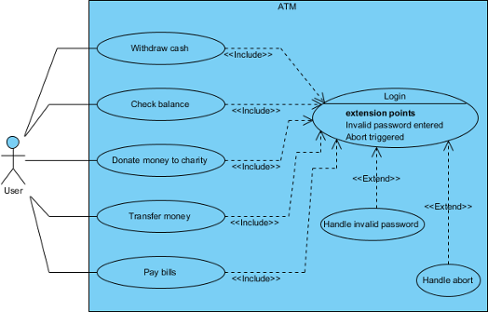
8. Use Case Diagram
Purpose: Describes system functionality from the user’s perspective, mapping actors to the capabilities they interact with.
Key Concepts:
-
Actors: External entities (users, systems) engaging with the system
-
Use Cases: Discrete units of functionality delivering user value
-
System Boundary: Rectangle defining scope and ownership
-
Associations: Lines connecting actors to relevant use cases
-
Relationships:
-
Include: Mandatory reuse of one use case within another
-
Extend: Optional behavior augmenting a base use case
-
Generalization: Inheritance between actors or use cases
-
When I Use It:
-
Facilitating requirements workshops with product and business teams
-
Creating a shared “feature menu” for sprint planning
-
Identifying scope boundaries during project kickoff
-
Communicating system capabilities to non-technical stakeholders
Best Practice: Keep use cases goal-oriented (“Place Order”) not feature-oriented (“Click Submit Button”). Document detailed flows separately.
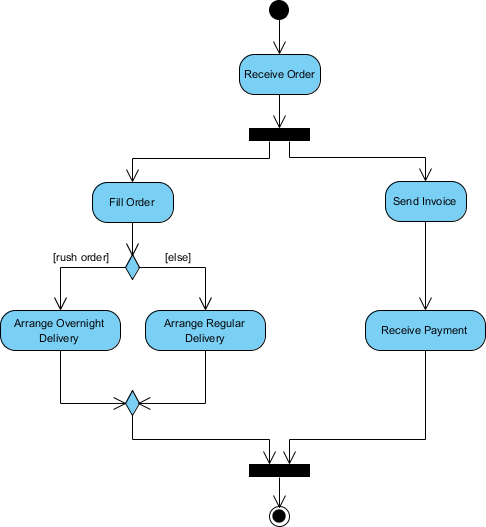
9. Activity Diagram
Purpose: Models workflows, business processes, and algorithmic logic through sequential and parallel activity flows.
Key Concepts:
-
Activities: Action steps or processing units
-
Control Flow: Arrows defining execution sequence
-
Decision Nodes: Diamonds for conditional branching
-
Merge Nodes: Reconvergence points for alternative paths
-
Fork/Join Nodes: Modeling parallel or concurrent activities
-
Initial/Final Nodes: Start and termination points
-
Swimlanes: Partitions assigning responsibility to roles or systems
-
Object Nodes: Representing data flow between activities
When I Use It:
-
Documenting complex business rules or approval workflows
-
Visualizing algorithm logic before implementation
-
Mapping user journey steps across multiple system boundaries
-
Identifying bottlenecks or parallelization opportunities
Power Feature: Swimlanes make cross-functional process ownership crystal clear—essential for DevOps and agile team alignment.
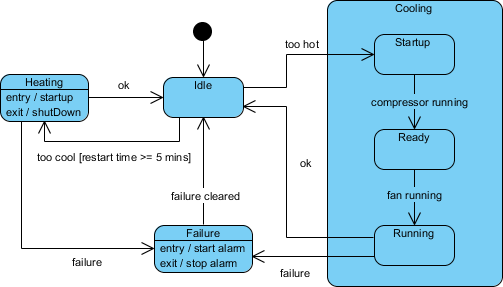
10. State Machine Diagram (State Diagram)
Purpose: Illustrates an object’s lifecycle through states, transitions, and the events that trigger changes.
Key Concepts:
-
States: Conditions where an object satisfies constraints or performs activities
-
Transitions: Directed edges showing state changes
-
Events: Triggers initiating transitions (signals, time, conditions)
-
Actions: Operations executed during transitions or within states
-
Initial/Final States: Entry and exit points of the lifecycle
-
Guards: Boolean conditions enabling/disabling transitions
-
Entry/Exit Actions: Activities bound to state boundaries
When I Use It:
-
Modeling UI component behavior (enabled/disabled/loading)
-
Designing order lifecycle management (pending → shipped → delivered)
-
Implementing protocol state machines (TCP, authentication flows)
-
Debugging unexpected state transitions in reactive systems
Real Impact: State diagrams prevented a critical bug in our subscription system by explicitly modeling edge cases like payment failures mid-upgrade.
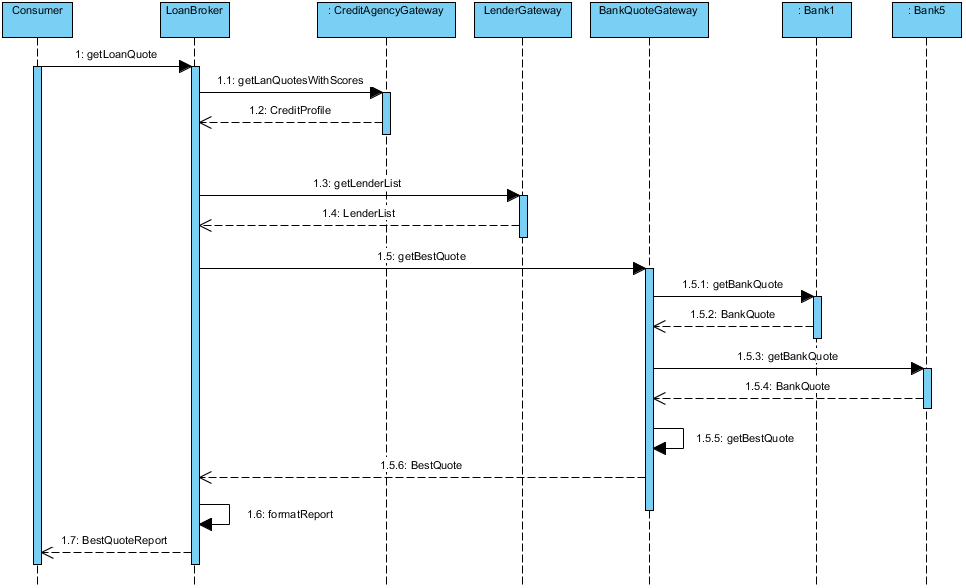
11. Sequence Diagram
Purpose: Details object interactions over time, emphasizing the chronological order of messages and method calls.
Key Concepts:
-
Lifelines: Vertical dashed lines representing participants over time
-
Activation Bars: Rectangles indicating when an object is executing
-
Messages: Horizontal arrows showing communication:
-
Synchronous: Solid arrow (caller waits for response)
-
Asynchronous: Open arrow (non-blocking call)
-
Return: Dashed arrow showing response flow
-
-
Time Axis: Vertical dimension representing temporal sequence
-
Combined Fragments: Boxes for loops, alternatives, and parallel regions
-
Self Messages: Operations an object invokes on itself
When I Use It:
-
Detailing complex use case scenarios for development teams
-
Documenting API contracts and microservice interactions
-
Debugging race conditions or unexpected call sequences
-
Onboarding engineers to critical system workflows
Pro Technique: Focus on one happy path per diagram. Use combined fragments sparingly to maintain readability.
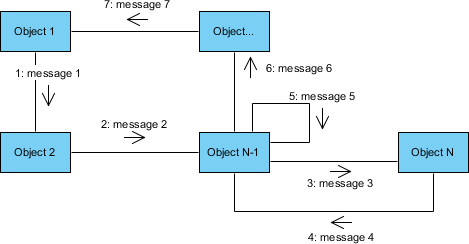
12. Communication Diagram (Collaboration Diagram)
Purpose: Emphasizes the structural organization of interacting objects and the messages they exchange.
Key Concepts:
-
Objects: Participants represented as labeled rectangles
-
Links: Lines connecting objects that exchange messages
-
Messages: Numbered arrows indicating sequence and direction
-
Sequence Numbers: Hierarchical numbering (1, 1.1, 1.2) for nested calls
-
Structural Focus: Highlights which objects collaborate, not just when
-
Semantic Equivalence: Interchangeable with sequence diagrams
When I Use It:
-
When object relationships matter more than precise timing
-
Providing a compact overview of simple interactions
-
Complementing sequence diagrams with a structural perspective
-
Reviewing collaboration patterns during architecture reviews
Trade-off Awareness: Easier to see “who talks to whom,” harder to follow complex temporal sequences—choose based on your audience’s needs.
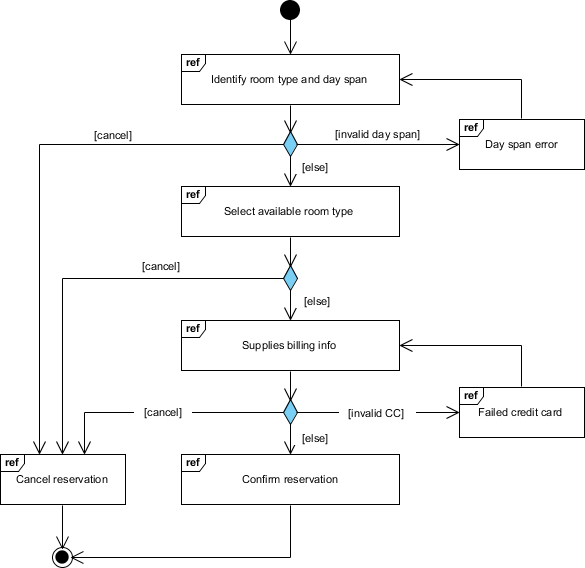
13. Interaction Overview Diagram
Purpose: Provides a high-level roadmap of interaction flows, blending activity diagram control flow with references to detailed interaction diagrams.
Key Concepts:
-
Interaction Occurrences: References to detailed sequence or communication diagrams
-
Control Flow: Activity-diagram-style arrows between interaction nodes
-
Decision/Merge Nodes: Conditional routing between interactions
-
Fork/Join Nodes: Parallel interaction branches
-
Abstraction Layer: Hides message-level details for clarity
-
Navigation: Hyperlinks to underlying detailed diagrams
When I Use It:
-
Presenting end-to-end user journeys to executive stakeholders
-
Navigating complex systems with dozens of interaction scenarios
-
Structuring documentation suites for large enterprise applications
-
Bridging high-level process maps with technical interaction specs
Strategic Value: Acts as a “table of contents” for your interaction documentation—critical for maintainability at scale.
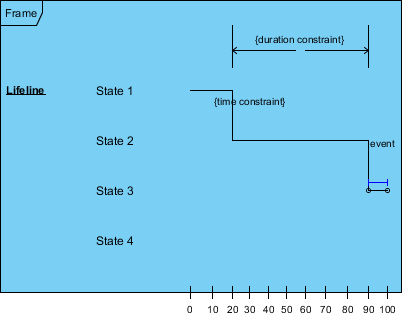
14. Timing Diagram
Purpose: Focuses on precise timing constraints and state changes over explicit time intervals, essential for real-time systems.
Key Concepts:
-
Reversed Axes: Time progresses left to right (not top to bottom)
-
Lifeline Compartments: Dedicated vertical sections per object or state variable
-
State Timeline: Visual representation of state transitions over time
-
Duration Constraints: Explicit time bounds on transitions or states
-
Time Observations: Markers for critical temporal checkpoints
-
Destruction Occurrences: Points where objects cease to exist
When I Use It:
-
Designing embedded systems with hard real-time requirements
-
Modeling hardware-software handshakes in IoT devices
-
Validating performance SLAs in distributed systems
-
Documenting protocol timing specifications
Niche but Critical: While not needed for every project, timing diagrams are indispensable when milliseconds matter—don’t overlook them for systems where timing is part of the contract.
SUMMARY TABLE: Quick Reference Guide
| Diagram Type | Category | Focus | Primary Use |
|---|---|---|---|
| Class | Structure | Static types & relationships | System design blueprint |
| Component | Structure | Software components | Architecture planning |
| Deployment | Structure | Hardware & software distribution | Infrastructure design |
| Object | Structure | Instance snapshots | Example validation |
| Package | Structure | Organization & dependencies | Large system organization |
| Composite Structure | Structure | Internal structure | Detailed component design |
| Profile | Structure | UML extensions | Domain-specific modeling |
| Use Case | Behavior | User-system interactions | Requirements gathering |
| Activity | Behavior | Workflow & processes | Business process modeling |
| State Machine | Behavior | Object lifecycle | Reactive system design |
| Sequence | Behavior | Time-ordered interactions | Detailed scenario modeling |
| Communication | Behavior | Structural interactions | Object collaboration |
| Interaction Overview | Behavior | High-level interaction flow | Navigation between diagrams |
| Timing | Behavior | Time constraints | Real-time system design |
BEST PRACTICES FROM THE TRENCHES
-
Start Simple, Scale Thoughtfully: Not every project needs all 14 diagrams. Begin with Class and Use Case diagrams, then add others as complexity demands.
-
Consistency Over Perfection: A slightly imperfect but consistent diagram set is more valuable than one flawless diagram that contradicts the rest.
-
Collaborate Early, Iterate Often: Share drafts with developers, testers, and business stakeholders. Their feedback shapes diagrams that actually get used.
-
Leverage Tooling Wisely: Modern AI-assisted tools can generate first drafts from natural language, but human review remains essential for semantic accuracy.
-
Document the “Why”: Use notes and constraints to capture design rationale—not just what the diagram shows, but why choices were made.
-
Keep Models Alive: Treat diagrams as living artifacts. Update them alongside code to preserve their value as documentation and communication tools.
-
Tailor to Your Audience: A diagram for executives emphasizes outcomes and scope; one for engineers includes technical details. Adjust granularity accordingly.
Conclusion: Turning UML from Theory into Team Superpower
After years of experimenting with different modeling approaches, I’ve learned that UML’s true power isn’t in creating perfect diagrams—it’s in fostering shared understanding. The moment a complex architectural decision clicks for a stakeholder because they saw it visualized? That’s where UML earns its keep.
This guide has walked through all 14 diagram types not as academic exercises, but as practical tools you can deploy tomorrow. Whether you’re clarifying domain logic with a Class Diagram, aligning on requirements with a Use Case Diagram, or debugging a race condition with a Sequence Diagram, each serves a distinct purpose in your communication toolkit.
My personal workflow evolution: I now start projects with lightweight Use Case and Package diagrams to align scope, then layer in Class and Component diagrams during design sprints. For complex features, I pair Sequence diagrams (for timing) with Communication diagrams (for structure). Deployment and Timing diagrams come into play during infrastructure planning and performance-critical modules.
The AI advantage: Tools like Visual Paradigm’s AI-powered generators have transformed my workflow. Describing a requirement in plain English and getting a first-draft Class or Sequence diagram accelerates exploration without sacrificing precision. The key is treating AI output as a starting point for refinement, not a final artifact.
Final encouragement: Don’t let UML intimidate you. Start with one diagram type that solves a current pain point. Share it. Iterate. As your confidence grows, expand your repertoire. The goal isn’t diagram mastery for its own sake—it’s clearer communication, fewer misunderstandings, and better software delivered faster.
💡 Remember: The best UML diagram is the one that gets read, understood, and acted upon. Simplicity, relevance, and collaboration beat exhaustive detail every time.
Model with purpose. Communicate with clarity. Build with confidence. 🚀
Reference
- Visual Paradigm UML Tool Features: Detailed overview of Visual Paradigm’s UML modeling capabilities, including support for all 13 standard UML diagrams, code engineering, and enterprise integration features.
- AI-Powered UML Diagram Generation Guide: Step-by-step tutorial on leveraging Visual Paradigm’s AI tools to generate UML diagrams from natural language descriptions, with practical examples and workflow tips.
- AI UML Diagram Generation Portal: Alternative access point for Visual Paradigm’s AI-assisted diagram generation features, enabling text-to-diagram conversion for rapid prototyping.
- The Complete Guide to UML AI-Powered Modeling: In-depth review of how artificial intelligence is transforming UML modeling workflows, with case studies on Visual Paradigm’s AI integration and practical implementation strategies.
- Visual Paradigm for Software Developers: Developer-focused guide highlighting Visual Paradigm’s code engineering, agile integration, and modeling best practices for modern software teams.
- AI Class Diagram Generator Tutorial (Video): Video demonstration of Visual Paradigm’s AI-assisted Class Diagram generation, walking through prompt engineering, refinement, and export workflows.
- AI Class Diagram Generator Release Notes: Official release documentation for Visual Paradigm’s AI Class Diagram Generator, detailing capabilities, usage instructions, and integration with desktop environments.
- AI UML Generator Basics: Text-to-Diagram: Foundational guide to using Visual Paradigm’s text-to-diagram AI, covering supported diagram types, prompt best practices, and output customization options.
- AI Modeling Chatbot Interface: Interactive AI chatbot for conversational model refinement, enabling natural language editing of UML diagrams without manual drag-and-drop.
- AI Package Diagram Generator Update: Release announcement for AI-powered Package Diagram generation, including use cases for large-system organization and dependency management.
- AI Profile Diagram Generation with OpenDocs: Specialized feature enabling AI-assisted creation of UML Profile diagrams with custom stereotypes, tagged values, and domain-specific constraints.
- AI Modeling Chatbot Demo (Video): Video showcase of conversational model editing using Visual Paradigm’s AI chatbot, demonstrating structural edits and relationship modifications via natural language.
- AI in Enterprise Architecture with TOGAF: Advanced tutorial integrating AI-powered UML modeling with TOGAF ADM and ArchiMate for enterprise-scale architecture planning.
- AI Deployment Diagram Example: Smart City Traffic: Practical example of generating a Deployment Diagram for a smart city traffic management system using AI prompt engineering.
- AI Class Diagram Refinement Demo (Video): Video tutorial showing how to refine AI-generated Class Diagrams through iterative prompting and manual adjustments in Visual Paradigm.
- AI Architecture Element Management (Video): Demonstration of using AI commands to reorganize architectural elements, move components between layers, and establish new connectors dynamically.
- AI Use Case Diagram Refinement Tool: Specialized AI tool for enhancing Use Case Diagrams by auto-suggesting «include» and «extend» relationships based on scenario analysis.
- AI-Assisted UML Class Diagram Generator Feature Page: Product page detailing Visual Paradigm’s guided wizard for AI-assisted Class Diagram creation, including scope definition, entity isolation, and validation steps.
- AI Class Diagram Generator Tool Interface: Direct access to the AI-assisted Class Diagram generation tool, featuring step-by-step guidance from requirements to validated model.
- Streamlining Enterprise Architecture with TOGAF Tools: Guide to integrating Visual Paradigm’s UML and AI capabilities with TOGAF Architecture Development Method for enterprise planning.
- AI-Assisted Class Diagram Generator (Alternate Link): Redundant link to the AI Class Diagram Generator feature page, emphasizing its role in accelerating object-oriented design workflows.
- AI Diagram Generation Overview: High-level overview of Visual Paradigm’s AI diagram generation capabilities across multiple UML diagram types and use cases.
- Import AI Activity Diagrams to Desktop: Release note detailing the workflow for importing AI-generated Activity Diagrams from cloud interfaces into Visual Paradigm Desktop for advanced editing.
- Export Options for AI-Generated Diagrams (Video): Video tutorial covering export formats for AI-generated diagrams, including PlantUML scripts, SVG images, and JSON for version control integration.
This post is also available in Deutsch, Español, فارسی, Français, English, Bahasa Indonesia, 日本語, Polski, Portuguese, Ру́сский, Việt Nam, 简体中文 and 繁體中文.