


A UML Activity Diagram is one of the behavioral diagrams in the Unified Modeling Language (UML). It visualizes the dynamic aspects of a system by modeling workflows, business processes, use case realizations, or algorithmic logic as a sequence (or concurrent set) of actions. Unlike flowcharts (which it resembles), activity diagrams are specifically designed for UML contexts, supporting object flows, concurrency (via forks/joins), structured control (decision/merge), and integration with other UML diagrams (e.g., use cases or sequence diagrams).
This case study uses the provided example — Blog Account Creation Process — as a concrete, beginner-friendly illustration to explain the key concepts and core elements of UML activity diagrams.
Case Study: Blog Account Creation Process
Scenario A blogging platform allows new authors to register. The process involves requesting account creation, selecting a type (e.g., free or premium), entering personal details, verifying them, and either creating the account (followed by sending a confirmation email) or rejecting the request. The workflow always ends after either success or failure.
This process is modeled in a UML activity diagram that demonstrates almost all fundamental elements of the notation in a compact, realistic way.
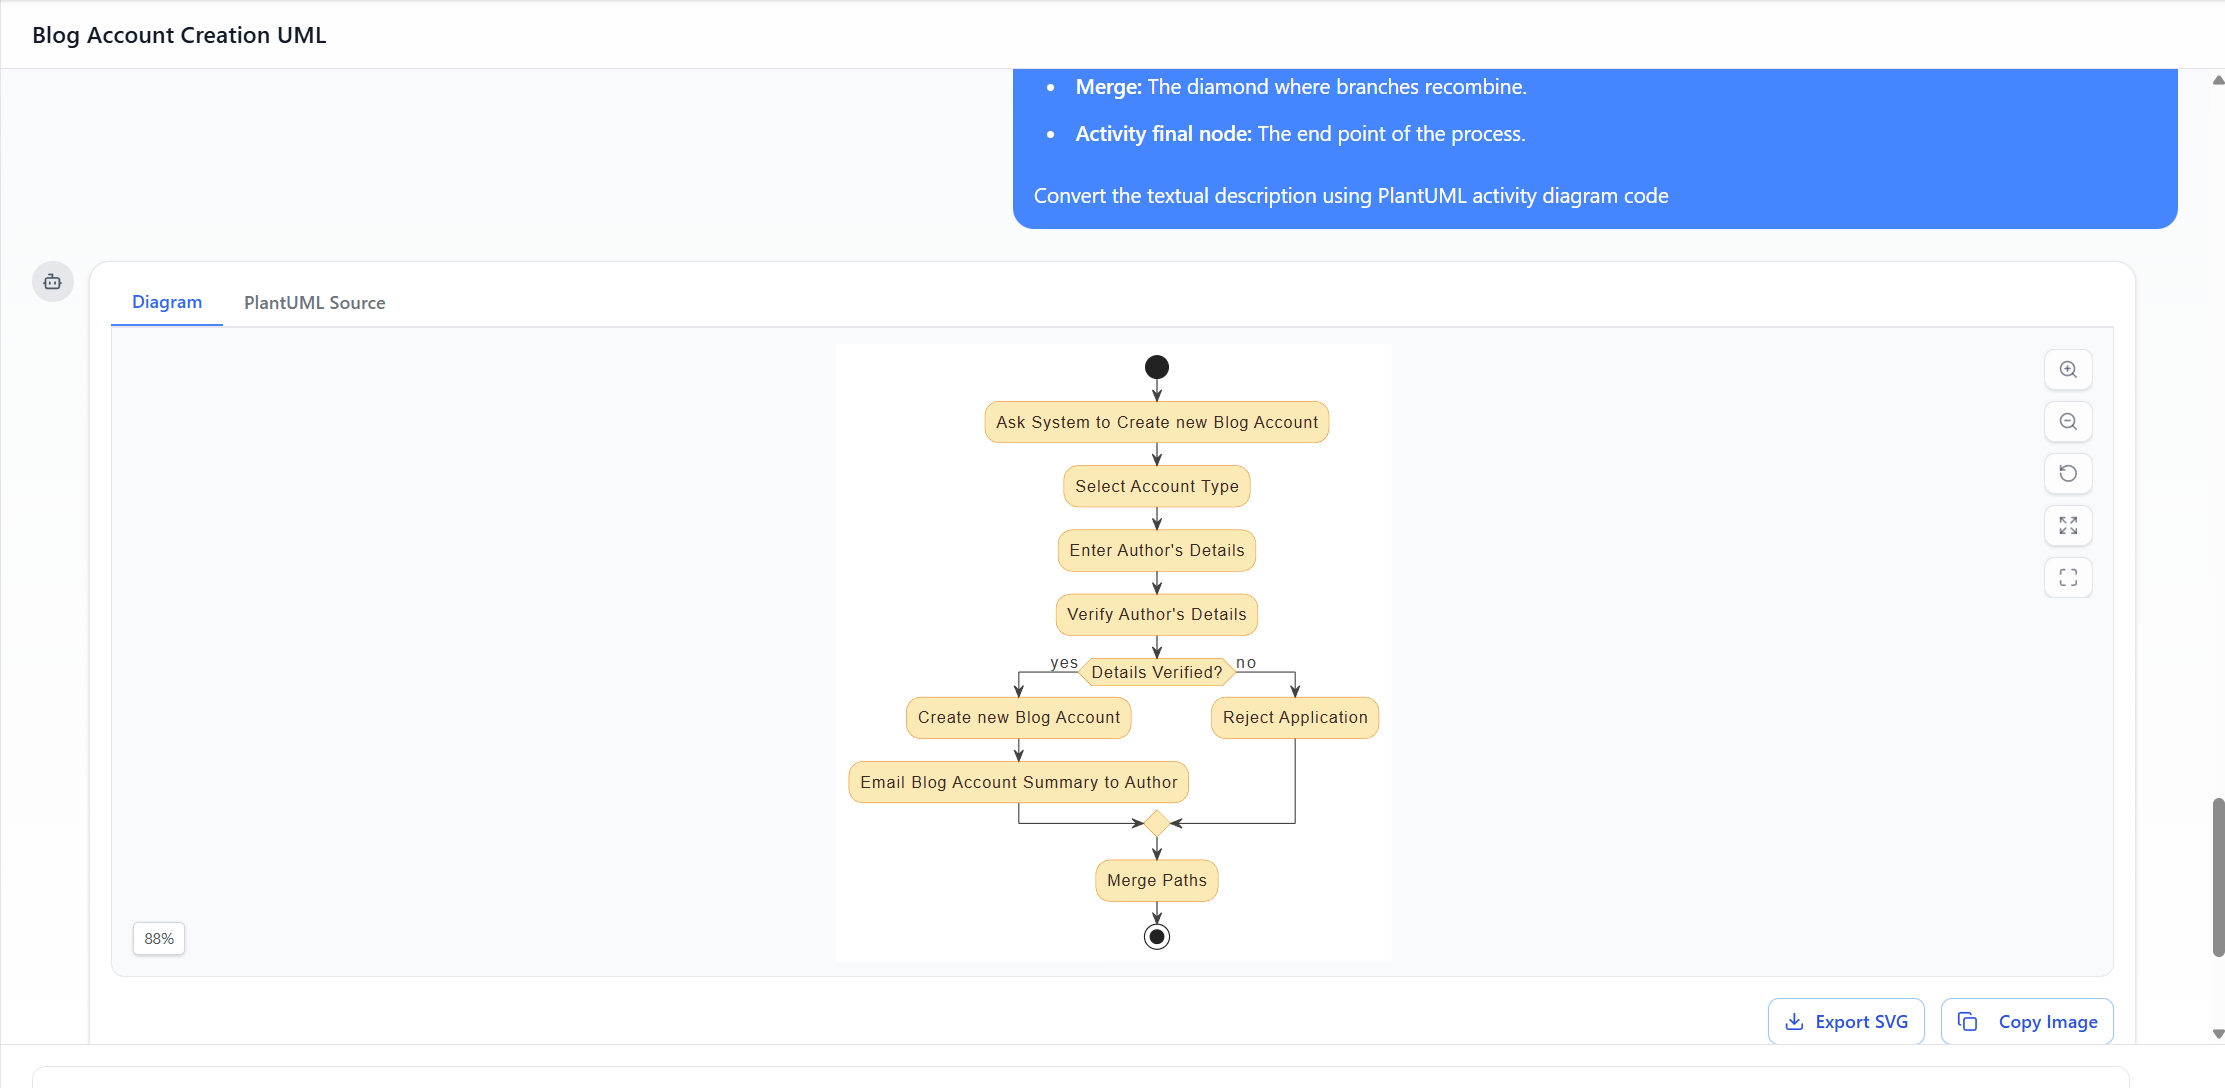
Diagram Flow Summary (based on the described diagram)
- Start → Ask system to create new blog account
- → Select Account Type
- → Enter Author’s Details
- → Verify Author’s Details
- → Decision: “Details Verified?”
- [yes] → Create new Blog Account → Email Blog Account Summary to Author
- [no] → Reject Application
- Both paths → Merge
- → End
The diagram also includes explanatory note elements labeling the syntax (Initial node, Edge, Action, Decision, Merge, Activity final node), making it an excellent tutorial example.
Key Concepts & Elements of UML Activity Diagrams (Illustrated by the Example)
- Initial Node
- Symbol: Solid black filled circle (●)
- Purpose: The single starting point of the entire activity (exactly one per activity diagram in most cases).
- In the example: The process begins at the top black circle. No incoming edges are allowed — it represents the trigger or invocation of the workflow (e.g., author clicks “Sign Up”).
- Action (or Action Node)
- Symbol: Rounded rectangle (nearly oblong)
- Purpose: Represents a single step, task, operation, or computation that is executed.
- In the example: Almost every step is an action:
- “Ask System to Create new Blog Account”
- “Select Account Type”
- “Enter Author’s Details”
- “Verify Author’s Details”
- “Create new Blog Account”
- “Email Blog Account Summary to Author”
- “Reject Application” These clearly show atomic units of work.
- Control Flow (Edge)
- Symbol: Arrow (→) connecting nodes
- Purpose: Shows the sequential or conditional progression from one node to another.
- In the example: Arrows connect every step in order, forming the main path and branching paths.
- Decision Node
- Symbol: Diamond shape (◇)
- Purpose: Represents a branching point where the flow chooses one (or more) outgoing path(s) based on a condition (guard).
- Guards: Boolean expressions on outgoing edges (e.g., [yes], [no], [Details Verified?], [else]).
- In the example: The diamond labeled “Details Verified?” splits the flow:
- Yes path → account creation
- No path → rejection This is the most common way to model conditional logic in activity diagrams.
- Merge Node
- Symbol: Diamond shape (same as decision node)
- Purpose: Combines two or more incoming alternate flows into a single outgoing flow. It does not wait/synchronize — it simply passes any arriving token forward immediately.
- In the example: The second diamond after both the success (email) and failure (reject) paths. It recombines the flows so the process has a single logical end. Important distinction: Decision = outgoing branch, Merge = incoming convergence. They share the same symbol but differ in number of incoming/outgoing edges.
- Activity Final Node
- Symbol: Bullseye (circle with inner solid circle) or sometimes a thick-bordered circle
- Purpose: Marks the completion of the entire activity. Reaching this node terminates all tokens/flows in the activity.
- In the example: The final bullseye symbol after the merge. Whether the account was created or rejected, the process ends here.
- Note / Comment
- Symbol: Rectangle with folded top-right corner, connected by a dashed line
- Purpose: Provides explanatory text, definitions, or annotations (non-normative).
- In the example: Several notes label the elements (e.g., “Initial node: The starting point.”, “Decision: The diamond where logic branches.”). This makes the diagram self-documenting and ideal for teaching UML syntax.
Additional Key Concepts (Beyond the Basic Example)
While the blog account diagram focuses on sequential flow + simple branching, real-world activity diagrams often include:
- Fork / Join (for concurrency): Bar with one incoming → multiple outgoing (fork) or multiple incoming → one outgoing (join). Not present here.
- Object Nodes / Pins (for data flow): Rectangles showing objects passed between actions.
- Swimlanes / Partitions (vertical/horizontal lanes): To show which actor/system/part performs each action.
- Expansion Regions: For loops or iterations.
- Interruptible Regions / Exception Handling: Advanced constructs for error paths.
Why This Example Is an Excellent Teaching Case
- Simplicity — Only uses the most fundamental elements (no concurrency, no objects, no swimlanes).
- Realism — Represents a common real-world registration workflow.
- Pedagogical notes — Explicitly labels every major symbol, turning the diagram into a mini-tutorial.
- Demonstrates control nodes — Clearly contrasts decision vs. merge (same shape, different semantics).
- Complete lifecycle — Starts at initial node, ends at final node, handles both success and failure paths.
Summary Table of Core Elements in the Blog Account Example
| Element | Symbol | Used in Example? | Role in the Diagram |
|---|---|---|---|
| Initial Node | Solid black circle | Yes | Starting trigger |
| Action | Rounded rectangle | Yes (multiple) | Individual steps/tasks |
| Control Flow | Arrow | Yes | Sequence and branching |
| Decision Node | Diamond | Yes | Verification branching ([yes]/[no]) |
| Merge Node | Diamond | Yes | Rejoins success/failure paths |
| Activity Final Node | Bullseye | Yes | Process completion (success or failure) |
| Note | Folded rectangle | Yes (multiple) | Explains UML syntax |
This case study using the Blog Account Creation activity diagram effectively illustrates how UML activity diagrams bridge requirements (e.g., use cases) and implementation by providing a clear, visual specification of procedural logic — a core strength of the notation in software engineering, business process modeling, and system analysis.

Step-by-Step Tutorial: Generating a UML Activity Diagram with Visual Paradigm AI Chatbot
Here is a clear, step-by-step tutorial for using the Visual Paradigm AI Chatbot (also referred to as the AI-Powered Visual Modeling Chatbot) to generate a UML Activity Diagram from a textual description, such as the Blog Account Creation Process. This is based on how the tool works in 2025–2026, as shown in your screenshots (chat.visual-paradigm.com interface, PlantUML source generation, diagram preview, export options, and iterative refinement).
- Access the AI Chatbot
- Go to https://chat.visual-paradigm.com/ (or the integrated AI toolbox at https://ai-toolbox.visual-paradigm.com/app/chatbot/ if using the full platform).
- Sign in with a Visual Paradigm account (free trial available; some features require a subscription for unlimited use/export).
- Start a New Chat (click the blue “+ New Chat” button).
- Give it a descriptive title, e.g., “Blog Account Creation UML Activity Diagram”.
- Provide a Clear Textual Description (Initial Prompt)
- In the chat input box at the bottom, type a detailed natural-language description of the process.
- Example prompt (copy-paste or adapt from your earlier description):
text
Generate a UML Activity Diagram for the Blog Account Creation Process. Start with an initial node. Then: Ask System to Create new Blog Account → Select Account Type → Enter Author's Details → Verify Author's Details. Then a decision node: "Details Verified?" with yes/no branches. If yes: Create new Blog Account → Email Blog Account Summary to Author. If no: Reject Application. Both paths merge at a merge node, then end at the activity final node. Include note annotations explaining UML elements like initial node, action, decision, merge, and final node. - Press Enter/Send. The AI processes it (progress bar may show, e.g., 80–90%).
- Review the Generated Diagram
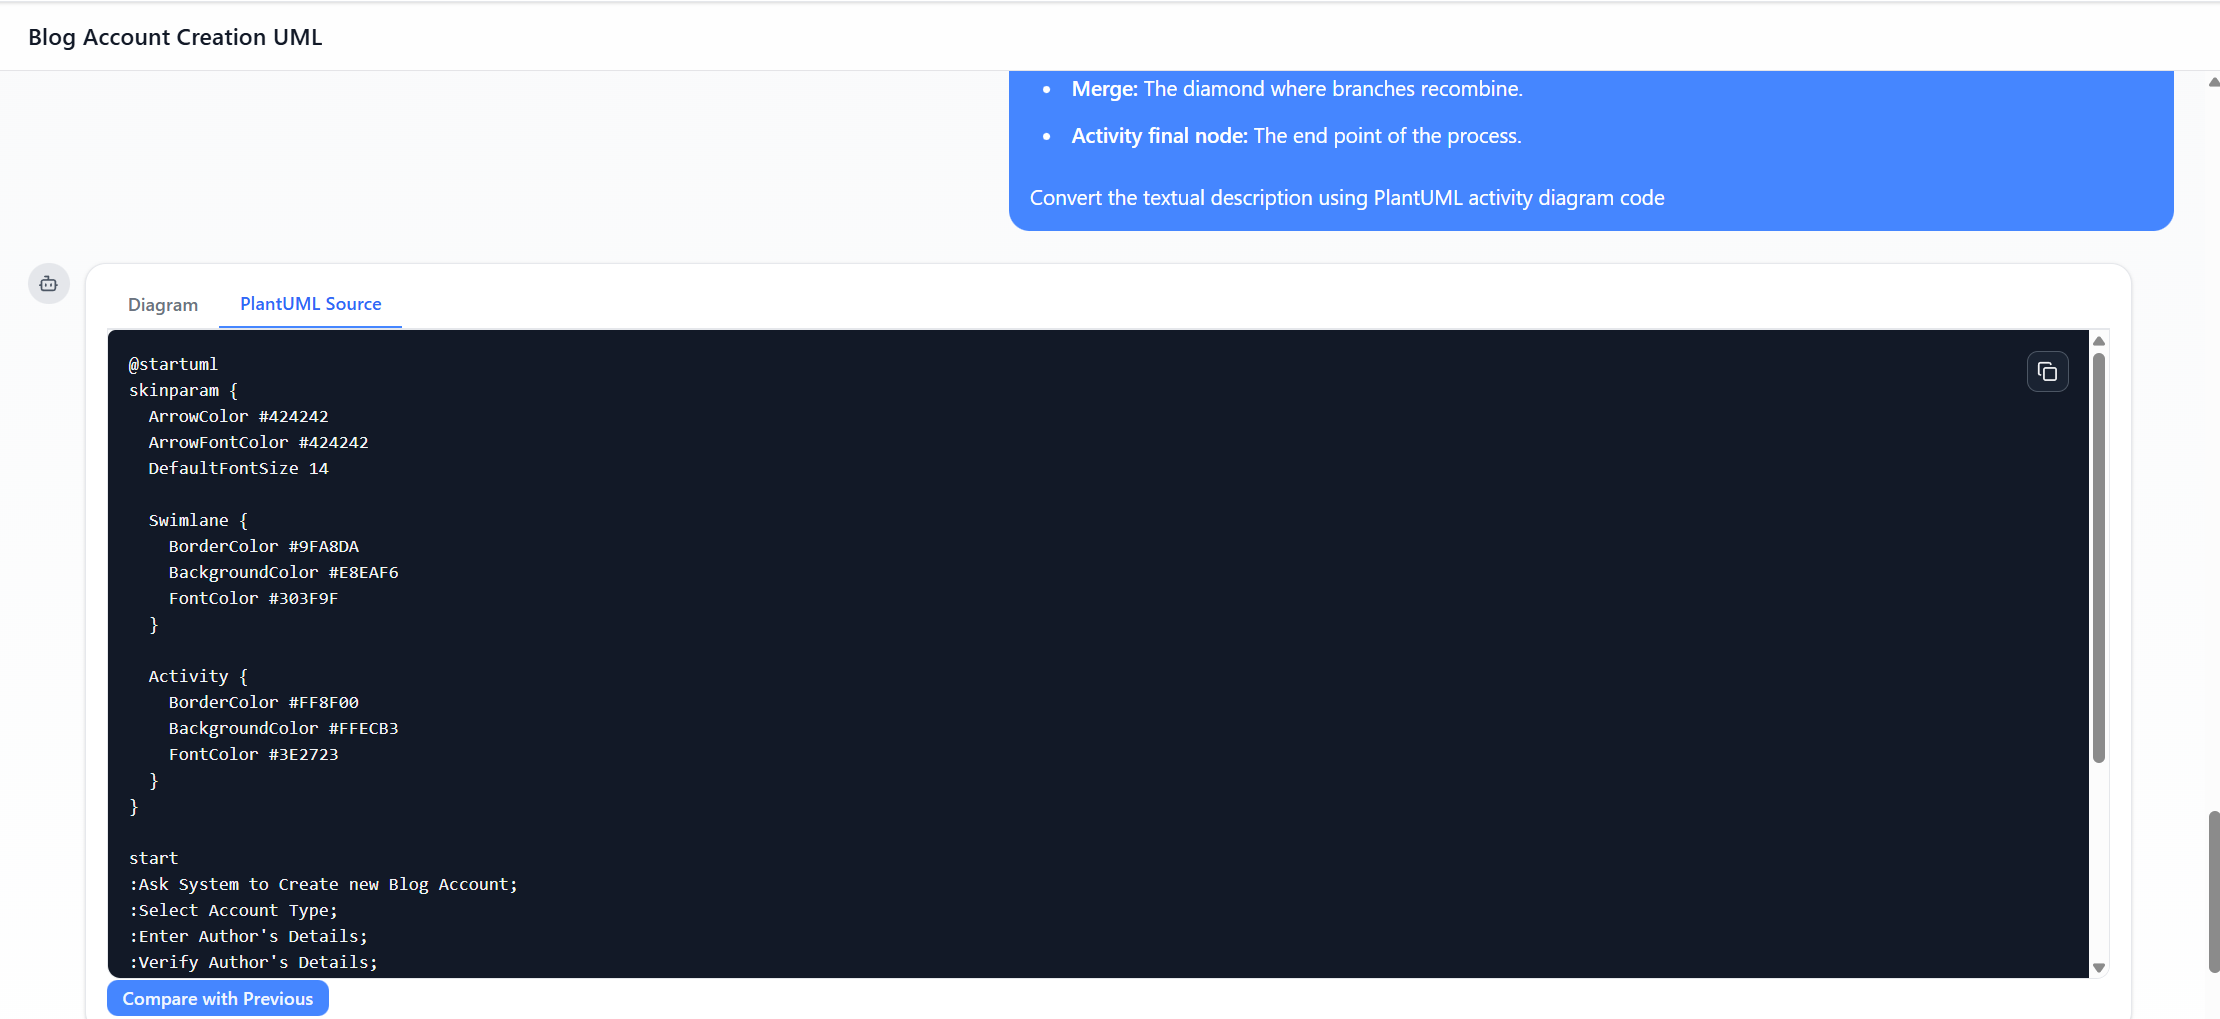
- The chatbot instantly renders the diagram visually (using PlantUML under the hood).
- Tabs appear: Diagram (visual preview) and PlantUML Source (editable code).
- Check for correctness: actions as rounded rectangles, diamond for decision/merge, arrows for flows, guards like [yes]/[no], start (black circle), end (bullseye).
- Iterate and Refine via Conversation
- If something is missing/wrong, reply in the same chat:
- “Add swimlanes for User and System.”
- “Change the merge node label to ‘Merge Paths’.”
- “Make the decision diamond labeled ‘Details Verified?’ more prominent.”
- “Add colors: blue for actions, green for success path.”
- “Include notes explaining: Initial node, Edge, Action, Decision, Merge, Activity final node.”
- The AI updates the diagram and PlantUML code in real-time (use “Compare with Previous” to see diffs).
- Continue until satisfied.
- If something is missing/wrong, reply in the same chat:
- Customize Style (Optional)
- In the chat, request:
- “Apply skinparam for better colors: ArrowColor #424242, BackgroundColor #E8EAF6.”
- Or edit the PlantUML source directly in the “PlantUML Source” tab (e.g., add @startuml … @enduml blocks, skinparam settings).
- In the chat, request:
- Export and Use the Diagram
- Click Export SVG (or PNG/JPG) for images.
- Copy Image for quick paste.
- For advanced editing/collaboration: Export to Visual Paradigm desktop (requires license/subscription) or share the chat link.
- Save the session for later (chat history persists).
Tips for Best Results
- Be specific in prompts (list steps sequentially, mention branches/guards explicitly).
- Use follow-up questions like “Explain why you used a merge node here” to learn UML.
- Trial mode has limits (e.g., usage % shown); subscribe for full exports/unlimited chats.
Comparison: AI Chatbot Approach vs. Traditional Diagram Creation Process
| Aspect | Traditional Manual Creation (e.g., in Visual Paradigm Desktop, Lucidchart, Draw.io, Visio) | AI Chatbot Approach (Visual Paradigm AI) |
|---|---|---|
| Starting Point | Open blank diagram → manually drag/drop shapes (initial node, actions, diamonds, arrows) | Type natural-language description → AI generates full diagram in seconds |
| Time to First Draft | 10–45 minutes (depending on complexity & user skill) | 10–60 seconds |
| UML/Syntax Knowledge Required | High — must know exact symbols (e.g., rounded rect for action, diamond for decision/merge, guards on edges) | Low — describe in plain English; AI handles correct notation |
| Error Risk | High — misplaced arrows, wrong shapes, missing merge, inconsistent styling | Lower — AI enforces UML standards (but still review output) |
| Iteration/Changes | Drag, resize, reconnect elements manually; tedious for big changes | Conversational: just type “add swimlane” or “change label” → instant update |
| Learning/Exploration | Slow — trial-and-error while learning UML | Fast — generate → ask “explain merge node” or “show alternative with fork/join” |
| Consistency & Standards | Depends on user expertise | High — trained on UML specs; consistent output |
| Collaboration | Share file; real-time only in some tools | Share chat URL; others see history & diagram; iterative co-editing via prompts |
| Best For | Precise pixel-perfect control, complex custom layouts, large-scale projects | Rapid prototyping, learning UML, quick iterations, non-experts, brainstorming |
| Limitations | Time-consuming setup; steep curve for beginners | May need refinements if prompt is vague; trial limits; less fine-grained control than manual drag |
Bottom Line The AI Chatbot dramatically accelerates the early stages — turning ideas into visual UML Activity Diagrams almost instantly — making it ideal for tutorials, quick proofs-of-concept, education, or when you’re short on time. Traditional manual creation remains superior for final polishing, very custom/complex diagrams, or when full graphical control is essential. Many users combine both: generate fast with AI → import/refine manually in Visual Paradigm desktop.
This approach (as seen in your screenshots) makes modeling more accessible and efficient while preserving UML fidelity.
This post is also available in Deutsch, Español, فارسی, Français, English, Bahasa Indonesia, 日本語, Polski, Portuguese, Ру́сский, Việt Nam, 简体中文 and 繁體中文.