


Reviewed: AI-Powered Infographic Generator (VP Online Combo & Desktop Professional)
In an era where visual content dominates digital communication, infographics have become essential tools for education, marketing, business reporting, and social media engagement. But how we create them has evolved dramatically—from hand-drawn sketches and labor-intensive design sessions to lightning-fast AI-driven workflows.
This comprehensive review compares traditional infographic creation by human designers with AI-powered infographic generation, analyzing the pros, cons, and real-world implications of each approach. Crucially, we also explore how Visual Paradigm’s AI-powered infographic tool elevates the process by integrating visual intelligence, data storytelling, and design automation—making it a game-changer for creators at every level.
🔹 Traditional Infographic Creation: The Designer’s Craft
✨ How It Works:
A traditional infographic is created through a multi-step, human-led process:
- Research & Conceptualization: The designer gathers data, defines the message, and sketches ideas.
- Storyboarding & Layout Planning: Drafting wireframes to map out visual hierarchy.
- Design Execution: Using tools like Adobe Illustrator, Figma, or Canva to build the final layout.
- Iteration & Feedback: Revisions based on client or team input.
- Export & Delivery: Finalizing in print- or web-ready formats.
✅ Pros of Traditional Design:
- Creative Control & Originality: Designers bring unique artistic vision, brand alignment, and storytelling nuance.
- Customization at a Deep Level: Every font, color, icon, and spacing decision is intentional and tailored.
- High Aesthetic Quality: Professional-grade visuals with polished details, consistent branding, and emotional resonance.
- Best for Complex or Unique Concepts: Ideal for niche topics, high-stakes presentations, or emotionally driven narratives.
❌ Cons of Traditional Design:
- Time-Consuming: A single infographic can take 3–10+ hours (or more) to complete.
- High Skill Barrier: Requires expertise in design software, typography, color theory, and visual storytelling.
- Costly: Hiring a professional designer can cost $100–$500+ per infographic.
- Scalability Issues: Difficult to produce multiple versions quickly (e.g., for A/B testing or multi-platform use).
- Dependency on Availability: Designers may be busy or unavailable, causing delays.
💬 Example: A university researcher spent 8 hours creating a detailed infographic on climate change impacts—only to revise it three times due to feedback. The final version was beautiful but delayed the publication.
🔹 AI-Powered Infographic Generation: The Future of Visual Content
✨ How It Works:
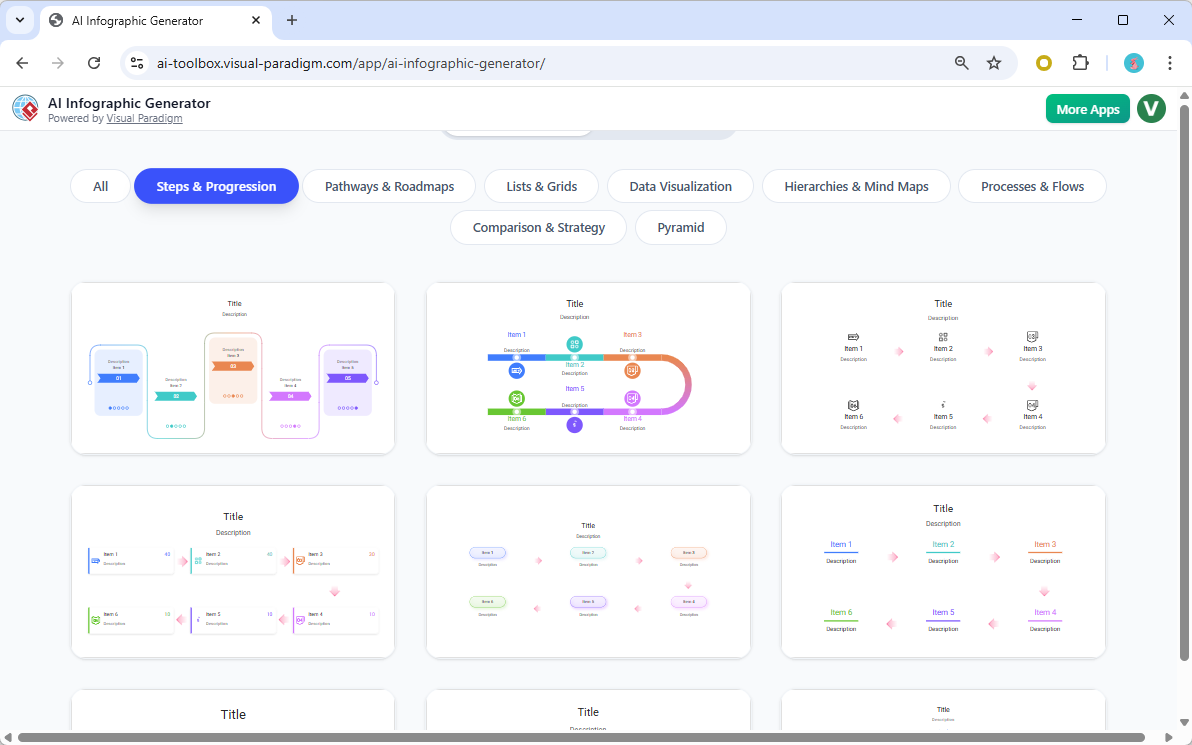
Using Visual Paradigm’s AI-Powered Infographic Generator, users input a simple text prompt, and the AI automatically:
- Analyzes the topic
- Suggests relevant data and structure
- Generates a visually balanced layout
- Applies color schemes, icons, and typography
- Allows real-time editing via a live editor
No design experience required.
✅ Pros of AI-Powered Creation:
- Speed & Efficiency: Create a professional-quality infographic in under 10 minutes.
- Low Skill Requirement: Anyone can generate high-quality visuals—no design training needed.
- Cost-Effective: Eliminates the need for freelance designers; ideal for small teams or solo creators.
- Scalability: Generate dozens of infographics in a single session (e.g., for a social media campaign or educational series).
- Smart Suggestions: AI recommends data points, layout improvements, and color palettes based on context.
- Cloud Integration & Collaboration: Save, share, and edit projects in real time across devices.
❌ Cons of AI-Powered Creation:
- Less Artistic Freedom: AI-generated designs can feel formulaic or generic if not customized.
- Limited Creative Nuance: May miss subtle emotional tones or brand-specific storytelling elements.
- Data Accuracy Risks: While AI pulls in data, it’s not always 100% accurate—users must verify sources.
- Over-Reliance on Templates: Can lead to visual repetition if users stick too closely to default layouts.
- Less Control Over Fine Details: Some users may find the editor less flexible than professional tools like Illustrator.
💬 Example: A marketing team used the AI tool to create 15 social media infographics in one afternoon—each took less than 5 minutes. While effective for reach, they lacked the unique branding flair of past designer-created assets.
🔎 Side-by-Side Comparison: Key Differences
🌟 How Visual Paradigm’s AI Infographic Generator Elevates the Experience
What truly sets Visual Paradigm’s AI-powered infographic tool apart is its integration of visual intelligence, data storytelling, and design automation—transforming the creation process from a manual chore into a strategic, intelligent workflow.
✨ Key Advantages of Visual Paradigm’s AI:
1. AI That Understands Context & Purpose
Unlike generic AI tools, Visual Paradigm’s AI analyzes the intent behind your prompt. For example:
- Prompt: “Show how remote work boosts employee productivity in 2025.”
- AI responds with: A dynamic comparison infographic showing stats on productivity, burnout, and work-life balance—with data from credible sources like Gartner and Buffer.
🔍 The AI doesn’t just layout text—it interprets the narrative and selects the right visual metaphors.
2. Smart Data Visualization Engine
Visual Paradigm automatically converts raw data into meaningful charts and graphs:
- Input: “Sales increased by 32% in Q1, 41% in Q2, and 56% in Q3.”
- Output: A clean, animated line chart with trend indicators, color-coded growth, and a summary stat.
📊 No need to manually format Excel data—just paste it, and the AI does the rest.
3. Visual Paradigm’s Design Intelligence™
This proprietary AI system learns from millions of professional infographics to:
- Suggest optimal visual hierarchy (what to highlight first).
- Recommend color palettes based on emotional tone (e.g., calming blues for wellness, energetic reds for urgency).
- Propose icon sets that match your topic (e.g., remote work → laptop, home office, video call icons).
🎨 It’s like having a senior designer in your pocket—offering pro-level insights in real time.
4. Integrated Storytelling Framework
Visual Paradigm doesn’t just make infographics—it helps you tell a story:
- Use the “Narrative Flow” feature to guide the viewer through a logical journey: problem → data → insight → solution.
- Add callout boxes, arrows, and transitions to guide attention.
🧠 Perfect for educational content, investor pitches, or campaign messaging.
5. Seamless Integration with Other Visual Tools
As part of the Visual Paradigm ecosystem, the AI infographic generator works with:
- Mind Maps (for brainstorming)
- Flowcharts & Process Diagrams (for workflows)
- Presentation Tools (for slide integration)
- User Journey Maps (for customer experience)
🔄 Create a full visual narrative across multiple formats with one unified platform.
🎯 When to Use Which Method?
✅ Use Traditional Design When:
- You need a one-of-a-kind, emotionally resonant visual (e.g., a nonprofit campaign).
- Brand identity and consistency are critical.
- The content is highly complex or abstract (e.g., scientific research, abstract philosophy).
- You’re producing a print-ready, high-resolution piece for exhibitions or publications.
✅ Use Visual Paradigm’s AI-Powered Generator When:
- You need fast, scalable content (e.g., weekly social media posts).
- You’re on a tight deadline or budget.
- You’re not a designer but need professional visuals (e.g., students, teachers, small business owners).
- You want to prototype ideas quickly before investing in full design.
- You’re creating multiple variations (e.g., A/B test layouts or localized versions).
- You want to leverage data storytelling with minimal effort.
🔮 The Future: Hybrid Approach – The Best of Both Worlds
The most powerful strategy isn’t choosing one method over the other—but combining them.
💡 Hybrid Workflow Example:
- Use AI to Generate a Draft: Input your idea into Visual Paradigm’s AI tool to get a fast, structured layout.
- Hand-Edit for Branding & Emotion: Import the AI-generated file into Figma or Illustrator and refine colors, fonts, icons, and imagery.
- Add Human Touch: Insert custom illustrations, adjust emotional tone, or include storytelling elements.
- Finalize & Publish: Export and share with confidence.
✅ Result: Speed + creativity + brand consistency. A perfect balance.
✅ Final Verdict: AI Isn’t Replacing Designers—It’s Empowering Them
The AI-Powered Infographic Generator from Visual Paradigm isn’t a threat to professional designers—it’s a force multiplier.
While AI can’t replicate the soul, intuition, and emotional depth of human creativity, it removes the tedious, time-consuming tasks that slow down the design process. This allows designers to focus on strategy, storytelling, and innovation—not layout and formatting.
For non-designers, AI unlocks the ability to create visually compelling content that was once out of reach.
🏁 Bottom Line:
- Traditional design remains unmatched for high-end, unique, and emotionally powerful visuals.
- Visual Paradigm’s AI-powered infographic tool delivers speed, intelligence, and storytelling depth—making it ideal for teams, educators, and content creators.
- The ideal path? Use AI to accelerate the process, then elevate it with human creativity.
📌 Recommendation: Try Both, Then Decide
- New Users: Start with Visual Paradigm’s AI tool to build confidence and speed.
- Designers: Use AI to prototype and save time—then hand-edit for premium results.
- Teams & Organizations: Implement a hybrid workflow to maximize efficiency and quality.
🔗 Try Visual Paradigm’s AI-Powered Infographic Generator today (Free Trial Available)
Available with VP Online Combo and Desktop Professional editions.
🌟 Why Visual Paradigm Stands Out in the AI Space
Final Thought: The Power of Visual Paradigms in the Age of AI
In the age of information overload, the ability to communicate clearly and visually is power. With Visual Paradigm’s AI-powered infographic generator, we’re not just creating visuals—we’re shaping understanding, engagement, and impact.
Whether you’re a marketer launching a campaign, a teacher explaining a concept, or a business leader sharing insights, Visual Paradigm’s AI doesn’t just make infographics—it makes them meaningful.
🎯 The future of visual communication isn’t just automated—it’s intelligent, strategic, and human-centered.
Value Stream Mapping (VSM) and Visual Paradigm’s AI capabilities:
- Value Stream Mapping Software – Visual Paradigm Online: This cloud-based software enables teams to visualize, analyze, and optimize workflows for lean manufacturing and process improvement.
- Value Stream Mapping Tool – Visual Paradigm: A comprehensive tool designed to help organizations identify waste and enhance operational efficiency through visual workflow analysis.
- AI Chatbot – Visual Paradigm AI: This assistant allows users to go from a simple text prompt to a complete diagram in seconds, handling complex drawing tasks for various modeling needs.
- Comprehensive Guide to Value Stream Mapping: An in-depth guide explaining the fundamentals and benefits of VSM for continuous improvement in business operations.
- AI Powered Chart Generator: This AI-driven tool helps users visualize ideas and improve workflow efficiency by generating various breakdown structures and charts.
- What is Value Stream Mapping?: An educational overview explaining the concept and strategic importance of VSM in business process analysis.
- Value Stream Mapping as an Artifact of the Vision Phase: This resource explains how VSM serves as a critical artifact to align teams and define strategic direction during product development.
- AI-Powered Visual Modeling and Design Solutions: A platform for exploring cutting-edge AI-driven tools for visual modeling and diagramming to enable smarter development workflows.
- Eliminate Waste with Value Stream Mapping: A practical approach to using VSM to detect and eliminate eight types of waste in manufacturing and service processes.
- How to Use Value Stream Mapping in Six Sigma Projects: This article demonstrates how VSM enhances Six Sigma initiatives by identifying bottlenecks and supporting data-driven improvement strategies.
This post is also available in Deutsch, Español, فارسی, Français, English, Bahasa Indonesia, 日本語, Polski, Portuguese, Ру́сский, Việt Nam, 简体中文 and 繁體中文.