


Are you looking for a way to present complex information in a clear, engaging, and visually appealing format? Creating compelling infographics often requires significant time, design skills, and effort. But what if you could generate beautiful, data-rich infographics in just a few clicks? Today, we are thrilled to announce the launch of our latest innovation: the AI-Powered Infographic Generator! This revolutionary tool is designed to empower everyone, from marketers and educators to business professionals and students, to transform their ideas into professional-quality infographics effortlessly. Say goodbye to complicated design software and hello to the future of data visualization.
What is the AI Infographic Generator?
The AI Infographic Generator is an intelligent tool that uses the power of artificial intelligence to create custom infographics from simple text prompts. You provide the topic, and our AI does the heavy lifting—generating the structure, suggesting data points, and arranging it all into a polished design. It’s the ultimate AI-powered infographic maker for anyone who needs to communicate ideas visually and effectively.
Unleash Your Creativity with Powerful Features
Our infographic maker is packed with features designed to make your creative process as smooth as possible:
- Instant AI Generation: Simply describe your infographic’s topic. Our AI will analyze your input and instantly generate a complete infographic, saving you hours of work.
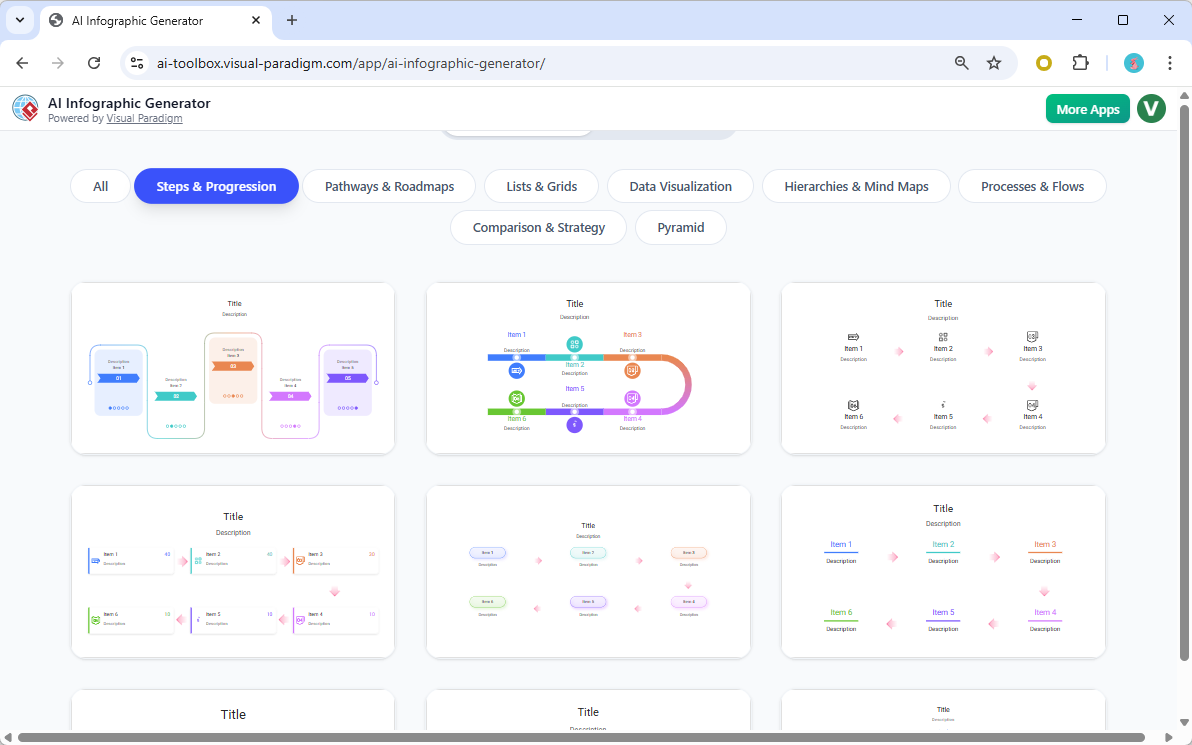
- Rich Template Gallery: Kickstart your project by choosing from a diverse collection of professionally designed templates. Whether you need a mind map, a process flow, or a statistical comparison, our online infographic tool has a template for you.
- Intuitive Live Editor: Want to make adjustments? No problem. Fine-tune every element of your creation with our real-time editor. Modify text, change icons, adjust colors, and tweak the layout with ease.
- High-Quality SVG Export: Download your work as a scalable vector graphic (SVG). This ensures your infographic looks crisp and professional, whether you’re embedding it on a website, including it in a presentation, or printing it on a poster.
- Cloud Saving & Sharing: Save your projects directly in the cloud to access and edit them anytime. You can also share your masterpiece with colleagues or friends through a unique link.
How to Create Infographics with AI in 3 Simple Steps
- Choose a Template: Browse the gallery and select a template that fits your vision.
- Describe Your Idea: Write a simple text prompt describing the information you want to visualize. For example, “A mind map about the benefits of a healthy diet.”
- Generate & Customize: Watch as the AI infographic generator brings your idea to life. Then, use the live editor to make any final adjustments to perfect your design.
Ready to Bring Your Data to Life?
Stop spending hours wrestling with complex design tools. Start creating dynamic, informative, and beautiful infographics today. Whether you need a data visualization tool for your business or a creative way to present a school project, our AI-powered solution is here to help.
Try the AI Infographic Generator Now!
Rewrite the article above to make it a comprehensive guide

Comprehensive Guide: How to Transform Your Ideas into Stunning Visuals with the AI-Powered Infographic Generator (2026 Edition)
Published: January 14, 2026 | Edition Required: Desktop Professional | VP Online Combo
In today’s fast-paced digital world, the ability to communicate complex ideas clearly and visually is more important than ever. Whether you’re a marketer crafting a campaign, an educator simplifying a lesson, a business analyst presenting insights, or a student working on a project, infographics have become essential tools for capturing attention and driving understanding.
But let’s face it—creating professional-quality infographics traditionally meant hours of manual design work, advanced software skills, and a deep understanding of visual hierarchy, color theory, and layout principles.
That’s about to change.
Introducing the AI-Powered Infographic Generator—a revolutionary, all-in-one solution designed to turn your ideas into polished, data-rich, and visually stunning infographics in minutes. No design experience required. No steep learning curve. Just your idea, and the AI does the rest.
This comprehensive guide walks you through everything you need to know to master the tool—from setup and customization to advanced workflows and real-world applications.
What Is the AI-Powered Infographic Generator?
The AI-Powered Infographic Generator is a next-generation, cloud-based design tool that leverages cutting-edge artificial intelligence to create professional-grade infographics from simple text prompts. It combines the power of natural language processing (NLP), data visualization algorithms, and intuitive design logic to deliver stunning results—fast.
Unlike traditional design platforms that require you to manually arrange every element, this tool understands your intent and translates it into a cohesive, visually engaging layout. It’s not just an infographic maker—it’s your intelligent design partner.
✅ Key Capabilities:
- Converts plain text into structured, data-driven visuals
- Suggests relevant data points and statistics based on context
- Auto-generates layouts optimized for clarity and aesthetics
- Offers real-time editing and customization
- Supports export in multiple formats (SVG, PNG, PDF, and more)
Whether you’re summarizing market trends, illustrating a scientific process, or mapping out a project timeline, the AI Infographic Generator adapts to your needs.
Why Use AI for Infographic Creation?
Before diving into the how-to, let’s explore why this tool is a game-changer:
|
Challenge
|
Traditional Approach
|
With AI-Powered Generator
|
|---|---|---|
|
Time-Consuming Design
|
2–5 hours per infographic
|
<15 minutes
|
|
Requires Design Skills
|
Need expertise in tools like Illustrator or Figma
|
No design background needed
|
|
Limited Creativity
|
Template constraints or blank canvas anxiety
|
AI suggests layout and content ideas
|
|
Inconsistent Quality
|
Dependent on user skill
|
Consistently professional output
|
|
Hard to Scale
|
Manual process doesn’t scale well
|
Batch-create multiple infographics easily
|
With the AI Infographic Generator, you can scale your visual content production without sacrificing quality—perfect for teams, educators, and content creators who need to produce high-impact visuals regularly.
Step-by-Step Guide: How to Create an Infographic in 3 Simple Steps
Follow this proven workflow to create a powerful infographic from scratch.
🔹 Step 1: Choose the Right Template
Start by selecting a template that aligns with your content type. The platform offers a rich library of professionally designed templates, categorized by purpose:
|
Template Type
|
Best For
|
|---|---|
|
Mind Map
|
Brainstorming, concept mapping, educational topics
|
|
Process Flow
|
Explaining step-by-step workflows (e.g., customer journey)
|
|
Comparison Chart
|
Side-by-side data analysis (e.g., product features, pros/cons)
|
|
Timeline
|
Historical events, project milestones, product launches
|
|
Statistical Infographic
|
Data visualization (e.g., survey results, market growth)
|
|
Hierarchy & Organization
|
Organizational charts, category breakdowns
|
👉 Pro Tip: Use the “AI Suggested Templates” feature—after entering your topic, the system recommends the most suitable layout based on your content.
🔹 Step 2: Input Your Idea with a Smart Text Prompt
This is where the AI shines. Instead of starting with a blank canvas, describe your idea in plain English.
✅ Use Clear, Descriptive Prompts:
- “Create a mind map showing the benefits of meditation on mental health, including stress reduction, focus improvement, and sleep quality.”
- “Design a timeline of major milestones in renewable energy adoption from 2000 to 2025.”
- “Make a comparison infographic between electric and gas-powered cars, highlighting cost, emissions, and maintenance.”
📌 AI Enhances Your Input:
The AI doesn’t just follow your instructions—it augments them by:
- Identifying key data points (e.g., “According to WHO, 1 in 5 adults experiences anxiety”)
- Suggesting relevant icons, charts, and color schemes
- Recommending layout improvements for readability
💡 Advanced Tip: Use the “Add Data” button to insert real statistics or datasets. The AI will automatically format them into charts, graphs, or visual indicators.
🔹 Step 3: Generate & Customize with the Live Editor
Once you hit Generate, the AI instantly builds your infographic. Within seconds, you’ll see a fully structured, visually appealing design.
Now comes the fun part—customization.
Use the intuitive live editor to refine your creation:
🔧 Key Customization Tools:
- Text Editor: Edit headlines, subheadings, and body copy with real-time preview.
- Icon Library: Search and insert thousands of customizable icons (e.g., health, technology, finance).
- Color Palette Selector: Choose from pre-designed themes or create your own using the color wheel.
- Layout Adjuster: Drag and drop elements to reposition them. The AI suggests optimal spacing and alignment.
- Chart & Graph Builder: Convert data into bar charts, pie charts, line graphs, or progress bars with one click.
- Image Upload & Integration: Add your own photos, logos, or illustrations.
✅ Pro Feature: Use AI Suggestions to get design tips—e.g., “Your color contrast is low; consider using a darker background for better readability.”
Advanced Features for Power Users
The AI Infographic Generator isn’t just for beginners—it’s built to support professionals who demand precision and scalability.
🚀 Advanced Tools:
- Batch Generation: Upload a CSV or Excel file with multiple topics, and the AI generates a series of infographics automatically.
- Brand Kit Integration: Upload your company’s logo, fonts, and color palette to maintain brand consistency across all visuals.
- Accessibility Mode: Enable high-contrast mode and alt-text suggestions for inclusive design.
- AI Voice Narration (Beta): Generate a spoken audio summary of your infographic for presentations or social media.
- Version History & Collaboration: Track changes, revert to previous versions, and collaborate in real time with team members.
🎯 Ideal For: Marketing teams creating campaign assets, educators building classroom materials, analysts producing executive summaries, and content creators scaling social media visuals.
Export & Share Your Infographic
Once your design is perfect, it’s time to share it with the world.
📤 Export Options:
- SVG (Scalable Vector Graphics): Ideal for websites and print (crisp at any size).
- PNG (High-Resolution): Great for social media and presentations.
- PDF (Print-Ready): Perfect for brochures, reports, and handouts.
- Animated GIF (Premium): Turn static infographics into engaging animated visuals.
🔗 Sharing Made Easy:
- Generate a Shareable Link: Send a link to colleagues, clients, or students—no downloads required.
- Embed Code: Copy HTML embed code to add your infographic directly to websites or blogs.
- Social Media Export: One-click export optimized for Instagram, LinkedIn, Twitter/X, and Facebook.
Real-World Use Cases
See how teams and individuals are using the AI Infographic Generator across industries:
|
Use Case
|
How It Helps
|
|---|---|
|
Marketing Teams
|
Create eye-catching social media content, product comparison guides, and campaign timelines in minutes.
|
|
Educators
|
Turn textbook concepts into visual lessons—e.g., a flowchart of photosynthesis or a timeline of ancient civilizations.
|
|
Business Analysts
|
Visualize KPIs, sales trends, and customer data for board meetings or reports.
|
|
Students & Researchers
|
Present complex research findings in a clear, engaging format for presentations or posters.
|
|
Nonprofits & NGOs
|
Communicate impact metrics and program outcomes to donors and stakeholders.
|
🌟 Example: A university professor used the tool to create 12 interactive infographics for a course on climate change—each one generated from a simple prompt and customized with real data from the IPCC.
Getting Started: Your First 5-Minute Infographic
Let’s walk through a real example:
🎯 Goal: Create a mind map about “The Benefits of Remote Work”
- Log in to your VP Online Combo or Desktop Professional account.
- Go to AI Infographic Generator > Select “Mind Map” template.
- Enter the prompt:
“Create a mind map showing the benefits of remote work, including flexibility, reduced commute time, increased productivity, and work-life balance. Include supporting stats like ‘74% of remote workers report higher job satisfaction’ (source: Buffer 2025 Work Trends Report).” - Click Generate.
- Review the AI-generated layout. Add your university logo and adjust colors to match your brand.
- Export as SVG and embed it into your course syllabus.
✅ Result: A professional, data-backed infographic ready to use—created in under 5 minutes.
Frequently Asked Questions (FAQ)
❓ Is prior design experience required?
No. The AI handles layout, color theory, and structure—just provide your idea.
❓ Can I use real data?
Yes! You can paste data from spreadsheets, import CSVs, or manually enter statistics.
❓ Is it secure?
Absolutely. All projects are stored securely in the cloud with end-to-end encryption. Data is never shared or sold.
❓ Can I use it offline?
The full AI-powered features require an internet connection. However, you can download and edit offline using the desktop app (available with Desktop Professional license).
❓ How much does it cost?
Pricing varies by edition:
- Free Tier: 3 projects/month, basic templates
- VP Online Combo: $19/month – unlimited projects, AI features, cloud sharing
- Desktop Professional: $49/month – full offline access, brand kit, batch generation
Final Thoughts: The Future of Visual Communication is Here
The AI-Powered Infographic Generator isn’t just a tool—it’s a transformation in how we create, share, and understand information. By combining human creativity with artificial intelligence, it empowers everyone to become a visual storyteller.
Whether you’re a solo creator or part of a large organization, this tool removes the barriers to professional-quality design and puts the power of data visualization in your hands.
🚀 Ready to Transform Your Ideas into Impactful Visuals?
Don’t wait—try the AI Infographic Generator today and see how fast, easy, and powerful visual storytelling can be.
👉 [Start Creating Your First Infographic Now]
Available for Desktop Professional & VP Online Combo users. Free trial available for all new users.
Stay ahead of the curve. Visualize smarter. Communicate better.
This post is also available in Deutsch, Español, فارسی, Français, English, Bahasa Indonesia, 日本語, Polski, Portuguese, Ру́сский, Việt Nam, 简体中文 and 繁體中文.