


📖 Why Visual Paradigm’s AI-Powered BPM Matters
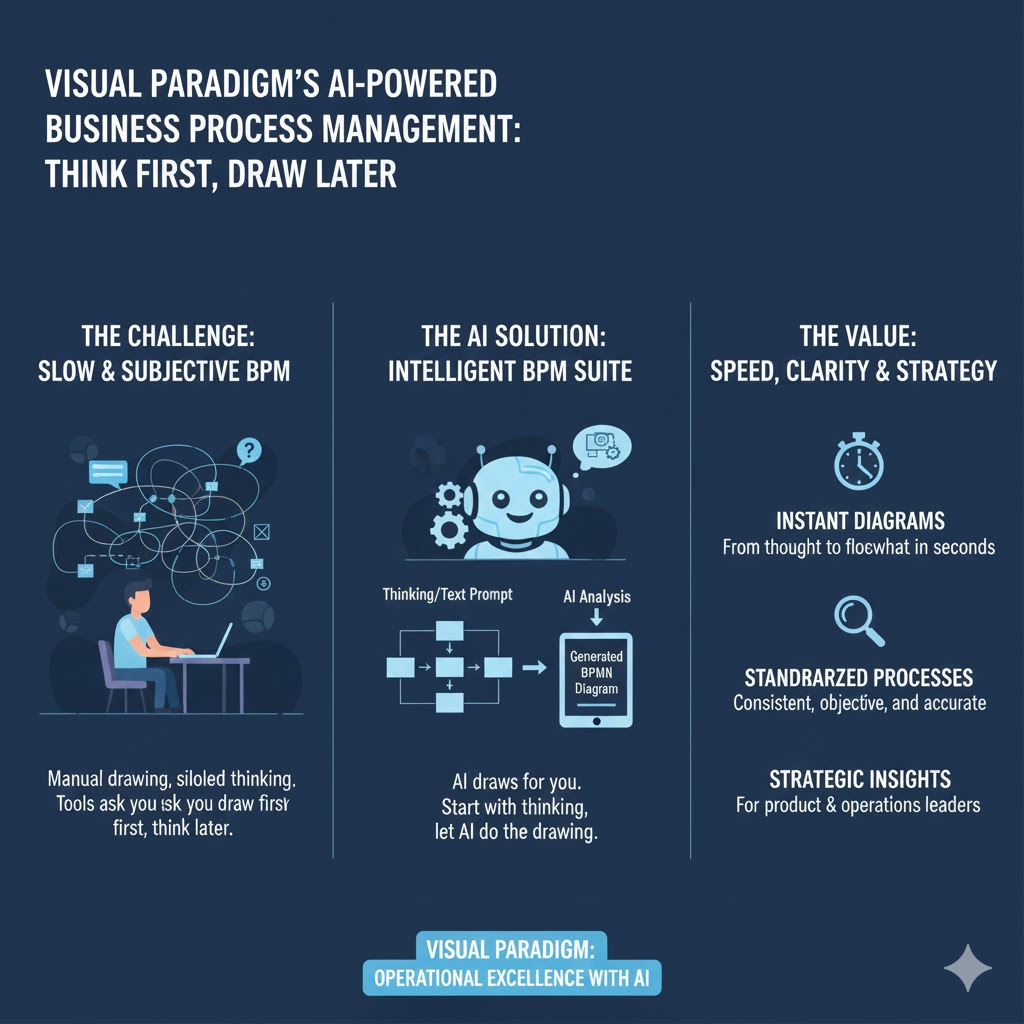
Business process mapping has long been a cornerstone of operational excellence—but it’s often slow, subjective, and siloed. Traditional tools ask you to draw first, think later. In contrast, the Intelligent BPM and Analysis Suite flips the script: start with thinking, let AI do the drawing.
This tutorial walks you through:
- The why and who behind this tool,
- A step-by-step workflow with real-world examples,
- Core concepts and best practices,
- A quick-reference summary table, and
- Strategic takeaways for product and operations leaders.
Whether you’re a Lead Product Manager scoping a new internal tool, an Operations Director optimizing onboarding, or a Scrum Product Owner aligning teams on process health—this suite cuts weeks of effort down to minutes.
🎯 Who Is This For?
| Role | Use Case |
|---|---|
| Product Managers (especially with HCI/CS backgrounds) | Map user journeys, define backend workflows for product features, align engineering + CX on process KPIs. |
| Operations & Process Leads | Automate SOP creation, identify bottlenecks, generate audit-ready documentation. |
| Agile/Scrum Teams | Turn sprint retrospectives into visual process improvements; link process changes to backlog items. |
| Leadership & Strategy | Rapidly model “as-is” vs. “to-be” workflows during transformation initiatives. |
💡 Ideal for hybrid teams in fast-paced environments (e.g., SF Bay Area tech orgs) where speed, clarity, and cross-functional alignment are non-negotiable.
🔑 Key Concepts
| Term | Definition | Why It Matters |
|---|---|---|
| Stakeholder Interaction Diagram (SID) | A standardized, role-based flow showing who does what and when. Not just swimlanes—focuses on handoffs and decision points. | Eliminates ambiguity; ideal for RACI alignment. |
| Process Story | A natural-language, chronological narrative of the workflow—generated by AI from your problem statement. | Bridges the gap between business language and technical modeling. |
| KPI-Driven Modeling | KPIs are defined in context of the process—not as afterthoughts. AI can recommend metrics based on industry norms (e.g., SaaS onboarding → Time-to-First-Value, Drop-off Rate). | Ensures measurement is built-in—not bolted-on. |
| AI Reports Suite | One-click generation of Implementation Plan, Risk Assessment, and Resource Plan—all derived from your model. | Turns static diagrams into actionable roadmaps. |
🛠️ Step-by-Step Tutorial (with Real Example)
Let’s walk through a realistic scenario:
“Our SaaS user onboarding has a 40% drop-off between signup and first meaningful action. We need to diagnose and redesign the flow.”
✅ Step 1: Overview — Define the Problem

Action: Enter a concise description in natural language.
Example Input:
“New users sign up but don’t complete setup; they drop off before using the core feature.”
AI Output:
- Structured problem statement
- Preliminary scope (e.g., “Focus: Post-signup flow up to first dashboard creation”)
- Suggested stakeholders: User, Backend Service, Email System, Support Bot
✅ Pro Tip: Be specific about pain points (e.g., “users abandon at step 3: email verification”) to improve AI precision.
✅ Step 2: Interactions — Build the Process Story
Action: Let AI generate a draft story—or edit it interactively.
AI-Generated Story (Draft):
- User submits signup form → system sends confirmation email.
- User clicks email link → system validates token and redirects to setup wizard.
- User enters workspace name → system creates draft workspace.
- Drop-off point: User asked to invite teammates before seeing value.
- If user skips, system shows empty dashboard → low engagement.
You can:
- Add missing steps (e.g., “User receives welcome email with video tutorial”)
- Flag bottlenecks (“Step 4 causes friction—validate with UX research”)
📝 Best Practice: Use “Actor → Action → Outcome” phrasing for consistency.
✅ Step 3: Visualize — Generate the Diagram
Action: Click “Generate Diagram”
The tool outputs a clean, auto-formatted Stakeholder Interaction Diagram:

Key Features:
- Color-coded roles (User = blue, System = gray, Team = green)
- Decision diamonds for conditional paths (e.g., “Invite teammates? → Yes/No”)
- Bottleneck warnings (e.g., red flag on step 4)
You can drag-and-drop to refine—no diagramming expertise needed.
✅ Step 4: KPIs — Measure What Moves the Needle
Action: Click “Add KPI” or ask AI:
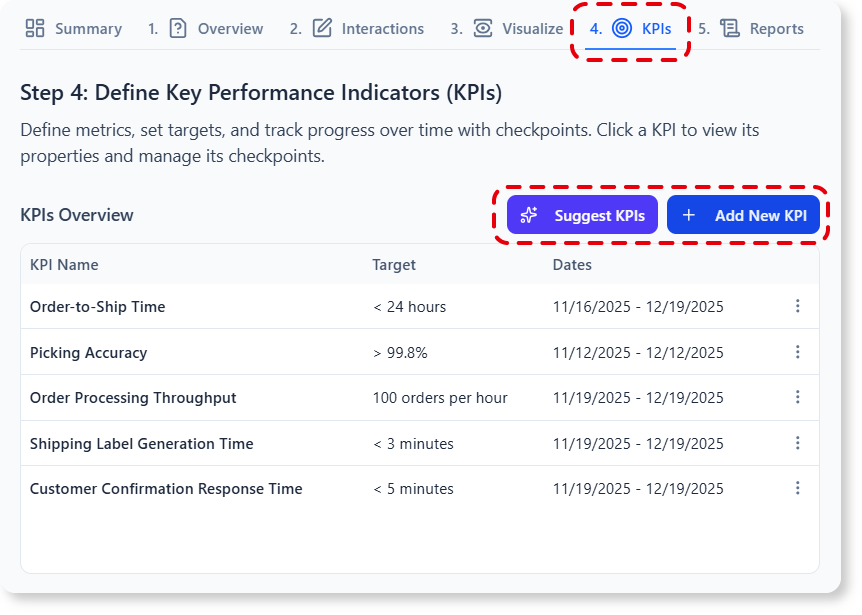
“Suggest KPIs for SaaS onboarding”
AI Suggestions:
| KPI | Target | Data Source |
|---|---|---|
| Signup-to-Setup Completion Rate | ≥ 85% | Auth logs + frontend events |
| Time-to-First-Value (TTFV) | < 3 min | Session recordings + analytics |
| Post-Setup Engagement (Day 1) | ≥ 2 feature uses | Product analytics (e.g., Mixpanel) |
You can:
- Link KPIs to specific steps (e.g., TTFV ↔ Step 3)
- Set alerts or thresholds
- Export to your BI dashboard (via API or CSV)
✅ Step 5: Reports — Turn Insight into Action
Click any report type:
- Implementation Plan
- Phased rollout: MVP (remove mandatory invites) → V2 (add tooltips) → V3 (guided tour)
- Owner assignments, estimated effort (story points), dependencies
- Risk Assessment
- High risk: Removing invite step may reduce virality
- Mitigation: Add optional “Share workspace” CTA after value demo
- Resource Plan
- Engineering: 2 devs × 1 sprint
- Design: 1 UX researcher for validation
- PM: Bi-weekly syncs with Growth team
🔄 All reports update dynamically when you edit the process model.
📊 Summary Table: Workflow at a Glance
| Step | Input | AI Output | Manual Override? | Output Format |
|---|---|---|---|---|
| 1. Overview | Problem statement (natural language) | Scope, stakeholders, success criteria | ✅ Edit scope | Text + checklist |
| 2. Interactions | Editable story draft | Chronological process narrative | ✅ Add/delete steps | Markdown-style list |
| 3. Visualize | Confirmed story | Stakeholder Interaction Diagram | ✅ Drag & drop | SVG/PNG (exportable) |
| 4. KPIs | Manual entry or AI prompt | KPIs with targets & sources | ✅ Adjust weights | Table + chart preview |
| 5. Reports | Select report type | Structured analysis doc | ✅ Comment/annotate | PDF, DOCX, or Notion embed |
🧠 Why This Changes the Game (Especially for Product Leaders)
For experienced Product Managers (7+ years, CS/HCI-trained), this tool directly augments core competencies:
| Traditional Approach | With Intelligent BPM Suite |
|---|---|
| 2–3 workshops to map a process | 20-minute AI-assisted session |
| Static Visio/Lucid diagrams → quickly outdated | Living models synced to KPIs & reports |
| KPIs defined after launch → reactive | Metrics baked in before build → proactive |
| “Process debt” accumulates | Technical + process debt tracked together |
✅ Bonus for Agile teams: Export stories directly to Jira as epics/tasks with linked diagrams.
🏁 Conclusion: From Diagrams to Decisions
The Intelligent BPM and Analysis Suite isn’t just another diagramming tool—it’s a process co-pilot that turns ambiguity into alignment, effort into insight, and ideas into execution plans.
Next Steps for You:
- 🔗 Try it now: https://ai-toolbox.visual-paradigm.com/app/intelligent-bpm-and-analysis-suite/
- 📅 Run a 30-min “Process Sprint” with your team: Pick one high-friction workflow (e.g., customer escalation, feature request triage) and model it end-to-end.
- 📊 Share your KPI dashboard and report outputs in your next sprint review.
“Clarity is the cornerstone of velocity.”
— Especially when you’re building products where every handoff, every delay, every drop-off matters.
Let AI handle the mapping—so you can focus on what matters most: building better experiences.
Prepared for product and operations leaders who believe process excellence should be fast, collaborative, and human-centered.
Tool compatible with Visual Paradigm Online (Combo+) and Desktop (Pro+ with active maintenance).
This post is also available in Deutsch, Español, فارسی, Français, English, Bahasa Indonesia, 日本語, Polski, Portuguese, Ру́сский, Việt Nam, 简体中文 and 繁體中文.