


Systems that respond to events, change conditions over time, or follow strict behavioral rules can be understood most clearly through a State Machine Diagram. In UML, this diagram visualizes how an object or component shifts from one state to another as different triggers occur. It captures the precise, event-driven nature of behavior and helps teams understand how something is expected to react under various scenarios.
What Is a UML State Machine Diagram?
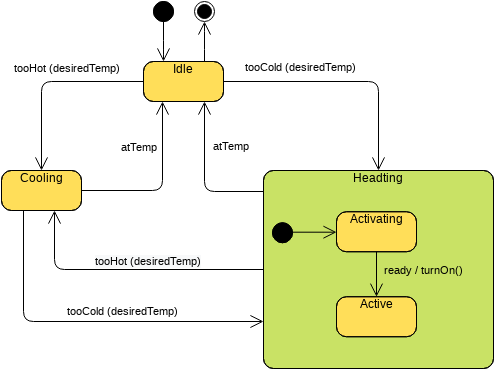
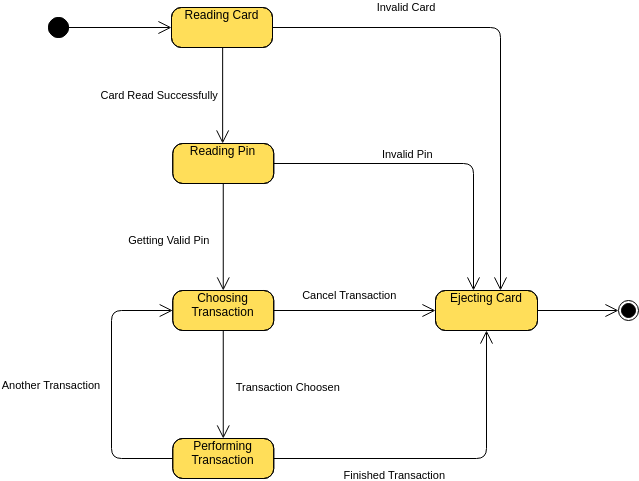
A State Machine Diagram illustrates the dynamic behavior of an object. Instead of focusing on structure, it maps out the possible states an object can be in, along with the transitions that occur when specific events are triggered. It can also represent actions that occur during transitions or while entering or leaving a state.
Key elements include:
- States – distinct conditions or modes, such as Idle, Active, or Error
- Events – triggers that cause a change, like timeout, submit, or disconnect
- Transitions – pathways that show how one state leads to another
- Actions – operations performed during state changes
- Guards – conditions that must be met before a transition can happen
Together, these elements form a detailed behavioral model that describes how something behaves throughout its lifecycle.
Why State Machine Diagrams Matter
State Machine Diagrams are valuable when behavior depends on sequences, reactions, or conditional flows. They help you:
- Clarify how a system behaves in response to events
- Ensure consistent and predictable logic
- Identify missing transitions or unreachable states
- Communicate rules and expectations with clarity
- Validate complex behavior before implementation
Because the diagram highlights how behavior unfolds step by step, it is commonly used in environments where correctness and reliability are essential.
Key Components Explained
- States:
Represent the status or condition of an object at a point in time.
Examples: Pending, Running, Completed. - Transitions
Show how an object moves from one state to another when an event occurs. - Events
Trigger state changes.
Examples include requestReceived, cancelPressed, sensorActivated. - Actions
Operations performed as part of a transition or while entering or exiting a state.
Examples: saveData(), resetTimer(), notifyUser(). - Guards
Boolean conditions that control whether a transition is allowed to happen.
When to Use a State Machine Diagram
State Machine Diagrams are particularly effective for modeling scenarios where behavior is controlled by rules, triggers, and conditions. Common uses include:
Object Lifecycles
Modeling how something progresses through phases, such as Created → Verified → Approved → Archived.
Device or System Controllers
Describing operational modes such as On, Off, Standby, or handling error recovery.
- User Interface Behavior:
Mapping how screens, buttons, or interactions change based on user actions or system updates. - Protocols and Communication Flows:
Showing message exchanges, retry logic, acknowledgements, or connection states. - Workflow and Automation Logic:
Defining conditional pathways where different events lead to different outcomes. - Event-Driven Software Components:
Any context where object behavior depends heavily on incoming events.
If the system’s behavior is driven by what happens next rather than what it contains, a State Machine Diagram is the right tool.
Common Use Cases Across Industries
State Machine Diagrams are used in various fields, such as:
- E-commerce – order processing logic
- Banking – transaction states and verification steps
- Healthcare – patient status transitions or treatment workflows
- Manufacturing – machine operation states and safety logic
- Transportation – ticket or trip status modeling
- Software Engineering – UI and component behavior, authentication flows
Whenever behavior can be described as a sequence of states triggered by events, this diagram provides the needed clarity.
Insights Provided by State Machine Modeling
By visualizing the possible states and transitions, teams can identify:
- All conditions an object may experience
- Which states are initial, transitional, or final
- Missing transitions or undefined behavior
- Where errors or unexpected conditions may arise
- Dependencies between events and outcomes
- Opportunities to simplify or improve logic
This makes State Machine Diagrams a powerful tool for designing systems that must behave correctly under a variety of conditions.
To better understand UML and its visualization through AI, take a moment to visit our UML resource hub.
This post is also available in Deutsch, Español, فارسی, Français, English, Bahasa Indonesia, 日本語, Polski, Portuguese, Ру́сский, Việt Nam, 简体中文 and 繁體中文.