


While Component Diagrams focus on the logical organization of your code modules, the UML Deployment Diagram bridges the gap to reality. It answers the crucial question: “Where does all this code actually live?”
This diagram is the only UML model dedicated to the physical runtime environment. It visualizes the mapping of software artifacts to hardware targets, illustrating how the system’s components are distributed across servers, databases, mobile devices, and cloud infrastructure. In the era of cloud computing, microservices, and IoT, understanding this physical architecture is more critical than ever.
The Anatomy of Physical Architecture
The primary goal of a Deployment Diagram is to show the physical topology of the system—the hardware (nodes) and the software (artifacts) that runs on it.
1. Nodes: The Hardware and Execution Environments
The fundamental building block of a deployment diagram is the Node. Nodes represent computational resources where artifacts are deployed for execution. They are depicted as 3D boxes (cubes).
Nodes come in two main flavors:
-
Device Nodes: These represent physical hardware resources with processing capability.
-
Examples: An Application Server, a Database Server, a Mobile Phone, an IoT Sensor, or a Load Balancer.
-
-
Execution Environment Nodes (Execution Environments): These are software-based containers that run within a device node and host specific types of artifacts. They represent the layer of software that manages the deployed components.
-
Examples: A Java Virtual Machine (JVM), a .NET CLR, a Docker Container, or a Web Browser instance.
-
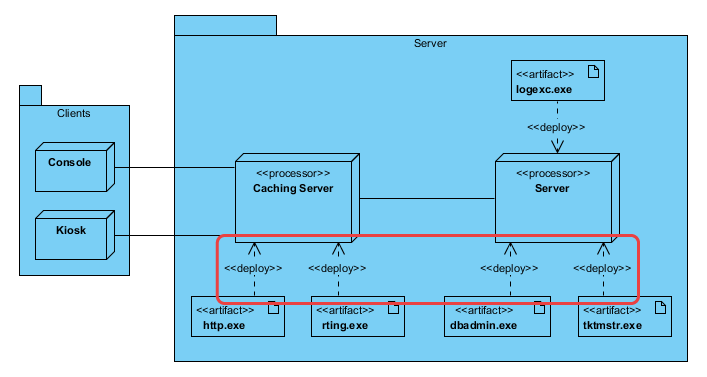
2. Artifacts: The Deployable Software
An Artifact represents the concrete physical manifestation of a software component. While a “Component” is a logical grouping of classes, an “Artifact” is the actual file that gets installed on the server.
Artifacts are typically drawn as a rectangle with the keyword «artifact» or a small document icon in the corner. They are often placed inside the Node to show where they are deployed.
-
Examples:
user-service.jar,index.html,database-schema.sql,config.xml, orpayment-api.exe.
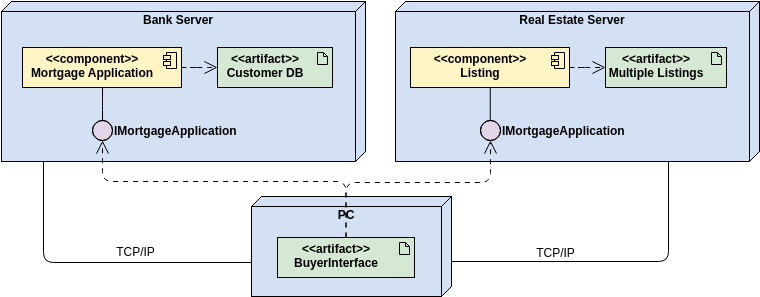
3. Communication Paths: The Connections
Nodes rarely operate in isolation. Communication Paths represent the physical connections or associations between nodes, showing how they exchange information.
These are drawn as solid lines connecting two nodes. Crucially, they are often labeled with stereotypes to indicate the communication protocol or network type being used.
-
Examples:
«HTTP/HTTPS»,«TCP/IP»,«JDBC»,«RMI», or«Message Queue».
Visualizing the Topology
A typical Deployment Diagram tells a story of the system’s runtime structure. For example, a standard three-tier web application might be visualized as follows:
-
Client Tier: A
Mobile Device(Node) containing aMobile App(Artifact). -
Middle Tier: A
Web Server(Device Node) hosting aDocker Container(Execution Environment), which inside holds theAPI Service.jar(Artifact). -
Data Tier: A
Database Server(Device Node) hosting aPostgreSQLinstance (Execution Environment), which manages theUser Data(Artifact).
Connecting these nodes would be lines labeled «HTTPS» (between Mobile and Web Server) and «JDBC» (between Web Server and Database).
Why Use a Deployment Diagram?
Deployment Diagrams are indispensable for DevOps engineers, system architects, and network administrators.
-
Deployment Planning: They serve as the definitive map for release management, detailing exactly which files need to go to which servers.
-
Performance Analysis: By visualizing the distribution of processing and the network links, architects can identify potential bottlenecks (e.g., too many artifacts on a single low-power node or slow network links between chatty services).
-
Security Modeling: They help identify security risks by highlighting which nodes are exposed to external networks (public internet) and which are isolated behind firewalls.
-
Infrastructure as Code (IaC) Design: In modern DevOps, these diagrams provide the conceptual blueprint for writing Terraform or CloudFormation scripts to provision cloud resources.
For extended information about UML and AI-assisted visualization, see our UML resource hub.
This post is also available in Deutsch, Español, فارسی, Français, English, Bahasa Indonesia, 日本語, Polski, Portuguese, Ру́сский, Việt Nam, 简体中文 and 繁體中文.