


(Click & Edit the Flowchart above Instantly) (Click & Create a new flowchart)
A flowchart is simply a graphical representation of steps. It shows steps in a sequential order, and is widely used in presenting flow of algorithms, workflow or processes. It is a type of diagram representing a process using different symbols containing information about steps or a sequence of events. Each of these symbols is linked with arrows to illustrate the flow direction of the process.
Flowchart was originated from computer science as a tool for representing algorithms and programming logic, but had extended to use in all other kinds of processes. Nowadays, flowcharts play an extremely important role in displaying information and assisting reasoning.
The purpose of a flow chart is to provide people with a common language or reference point when dealing with a project or process. It helps us visualize complex processes, or make explicit the structure of problems and tasks. A flowchart can also be used to define a process or project to be implemented.
Flowchart Symbols
Different flowchart shapes have different conventional meanings. The meanings of some of the more common shapes are as follows:
Terminator
The terminator symbol represents the starting or ending point of the system.

Process
A box indicates some particular operation.

Document
This represents a printout, such as a document or a report.

Decision
A diamond represents a decision or branching point. Lines coming out from the diamond indicates different possible situations, leading to different sub-processes.

Data
It represents information entering or leaving the system. An input might be an order from a customer. An output can be a product to be delivered.

On-Page Reference
This symbol would contain a letter inside. It indicates that the flow continues on a matching symbol containing the same letter somewhere else on the same page.

Off-Page Reference
This symbol would contain a letter inside. It indicates that the flow continues on a matching symbol containing the same letter somewhere else on a different page.

Delay or Bottleneck
Identifies a delay or a bottleneck.

Flow
Lines represent flow of the sequence and direction of a process.

Flowchart examples
Here are several flowchart examples. See how you can apply flowchart practically.
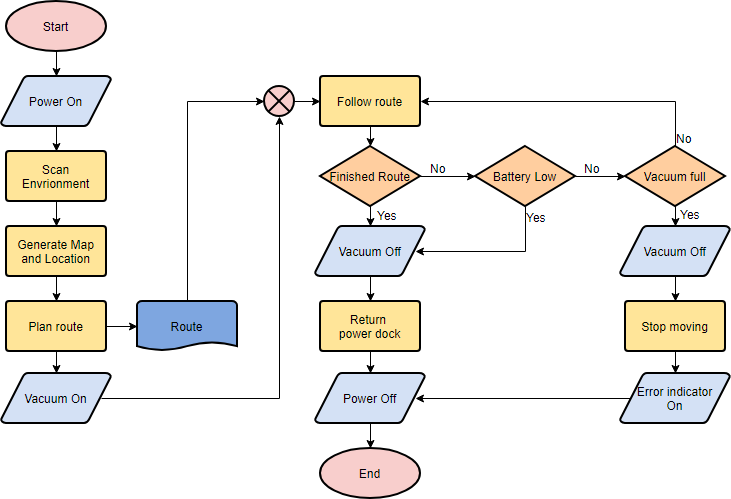
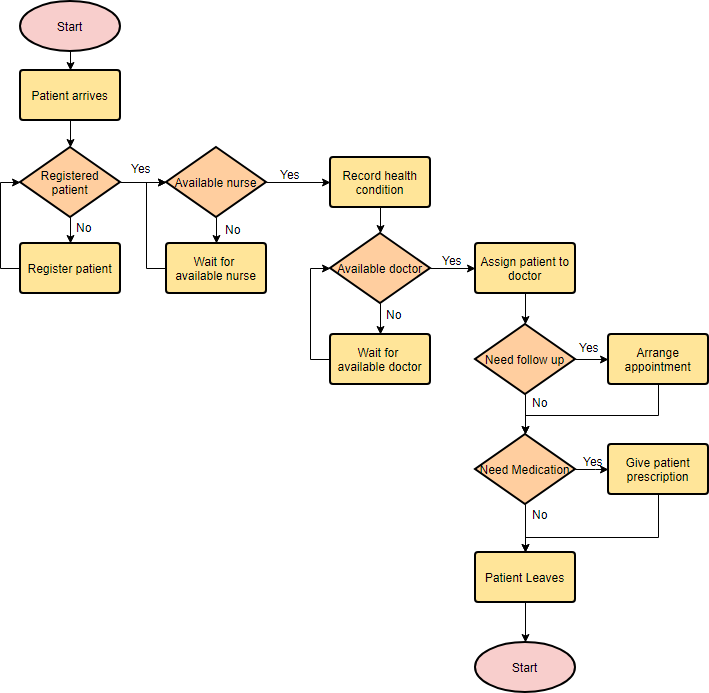
Flowchart Example — Medical Service
This is a hospital flowchart example that shows how clinical cases shall be processed. This flowchart uses decision shapes intensively in representing alternative flows.
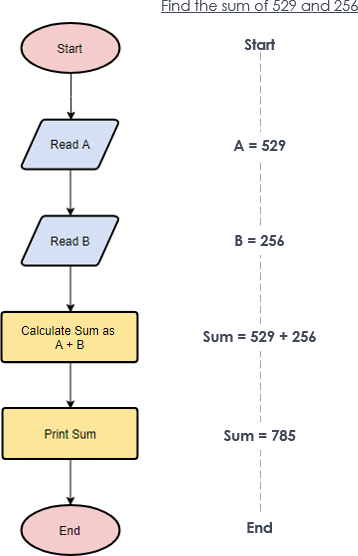
Flowchart Example — Simple Algorithms
Flowchart can also be used in visualizing an algorithms, regardless of its complexity. Here is an example that shows how flowchart can be used in showing a simple summation process.
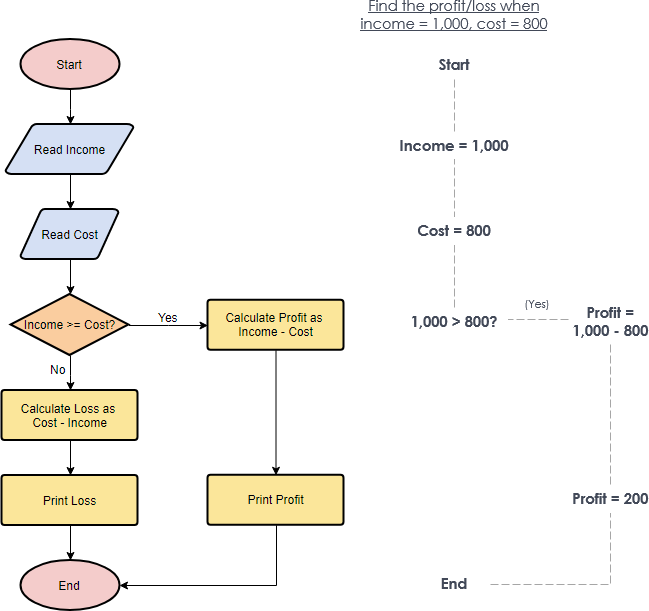
Flowchart Example — Calculate Profit and Loss
The flowchart example below shows how profit and loss can be calculated.
Creating Flowchart in Visual Paradigm
Let’s see how to draw a flowchart in Visual Paradigm. We will use a very simple flowchart example here. You may expand the example when finished this tutorial.
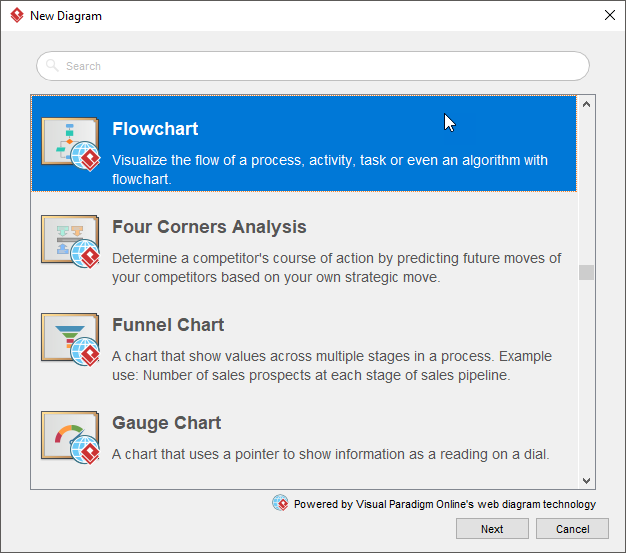
- Select Diagram > New from the main menu.
- In the New Diagram window, select Flowchart and click Next.
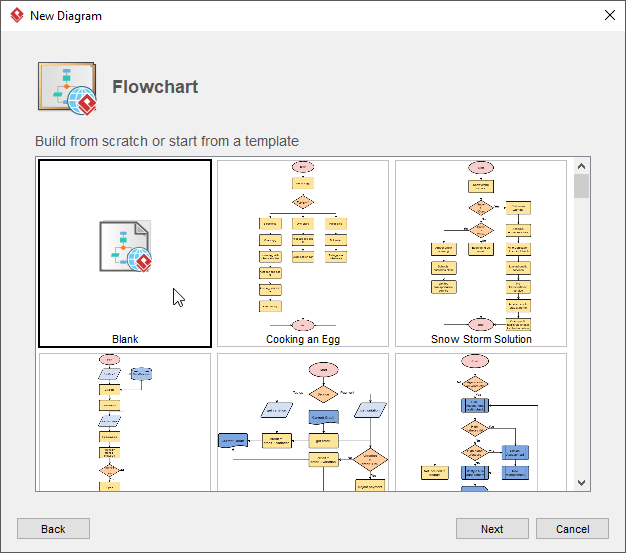
3. You can start from an empty diagram or to start from a flowchart template or flowchart example provided. Let’s start from a blank diagram. Select Blank and click Next.
4. Enter the name of the flowchart and click OK.
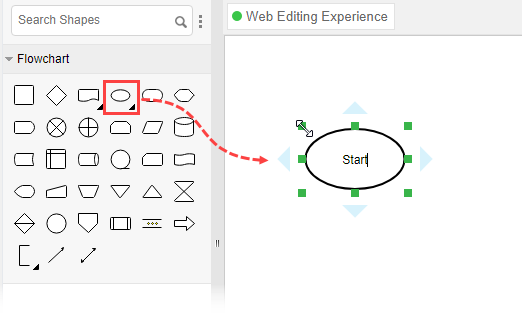
5. Let’s start by creating a Start symbol. Drag the Start shape from the diagram toolbar and drop it onto the diagram. Name it Start.
6. Create the next shape. Move your mouse pointer over the start shape. Press on the triangular handler on the right and drag it out.
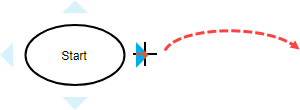
7. Release the mouse button. Select Flow Line > Process from the Resource Catalog.
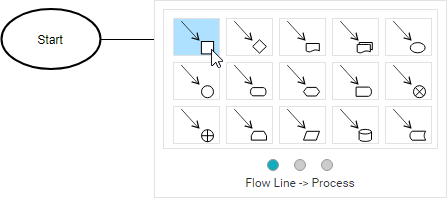
8. Enter Add items to Cart as the name of the process.
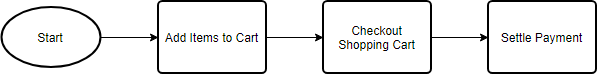
9. Follow the same steps to create two more processes Checkout Shopping Cart and Settle Payment.
10. End the flow by creating a terminator.
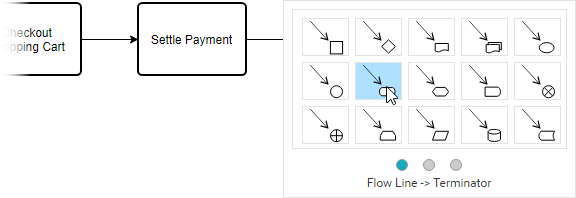
Your diagram should look like this:

11. Color the shapes. Select Diagram > Format Panel from the main menu. Select a shape on the diagram and click update its color through the Style setting in the Format Panel.
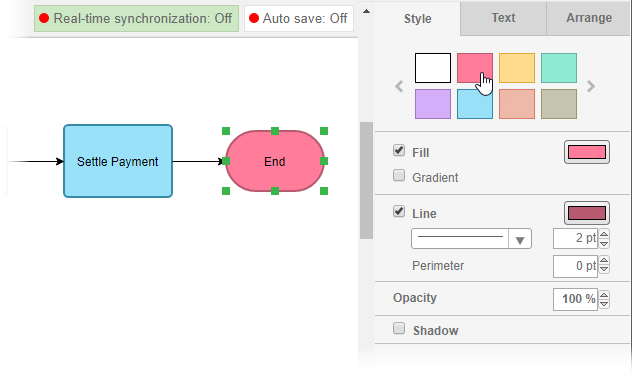
This is the final flowchart:

This post is also available in Deutsch, Español, فارسی, Français, English, Bahasa Indonesia, 日本語, Polski, Portuguese, Ру́сский, Việt Nam, 简体中文 and 繁體中文.