Creating C4 Deployment Diagrams: Mapping Infrastructure and Production Environments with Visual Paradigm’s AI-Powered C4 PlantUML Studio
This is the final article in the series — congratulations on reaching the end of your complete C4 modeling journey!
The **C4 Deployment Diagram** is a key supporting diagram that illustrates how instances of your software systems, containers, and components are deployed onto real infrastructure (e.g., servers, cloud regions, load balancers, databases, containers like Docker/Kubernetes, networks, firewalls, etc.). It bridges the gap between logical architecture (from Container/Component levels) and physical reality, answering critical questions for DevOps, operations, security, and scaling teams.
Visual Paradigm’s AI-Powered C4 PlantUML Studio generates these diagrams intelligently from your existing model, incorporating common deployment patterns (cloud icons, clustering, etc.) — making it effortless to document production, staging, or dev environments.
Step-by-Step: Generating Your C4 Deployment Diagram
- Ensure you are in the same project session in Visual Paradigm’s AI-Powered C4 PlantUML Studio.
- Navigate to the tab labeled 8. Deployment at the top of the interface.
- You’ll see the familiar PlantUML editor and preview pane.
- Click the Generate Diagram button. The AI will produce a complete **Deployment Diagram** based on your containers/components, typically showing:
- Infrastructure nodes (servers, VMs, cloud services, Kubernetes pods)
- Deployment of containers/components onto those nodes
- Networking, load balancing, databases, and external services
- Environment-specific details (e.g., production vs. staging)
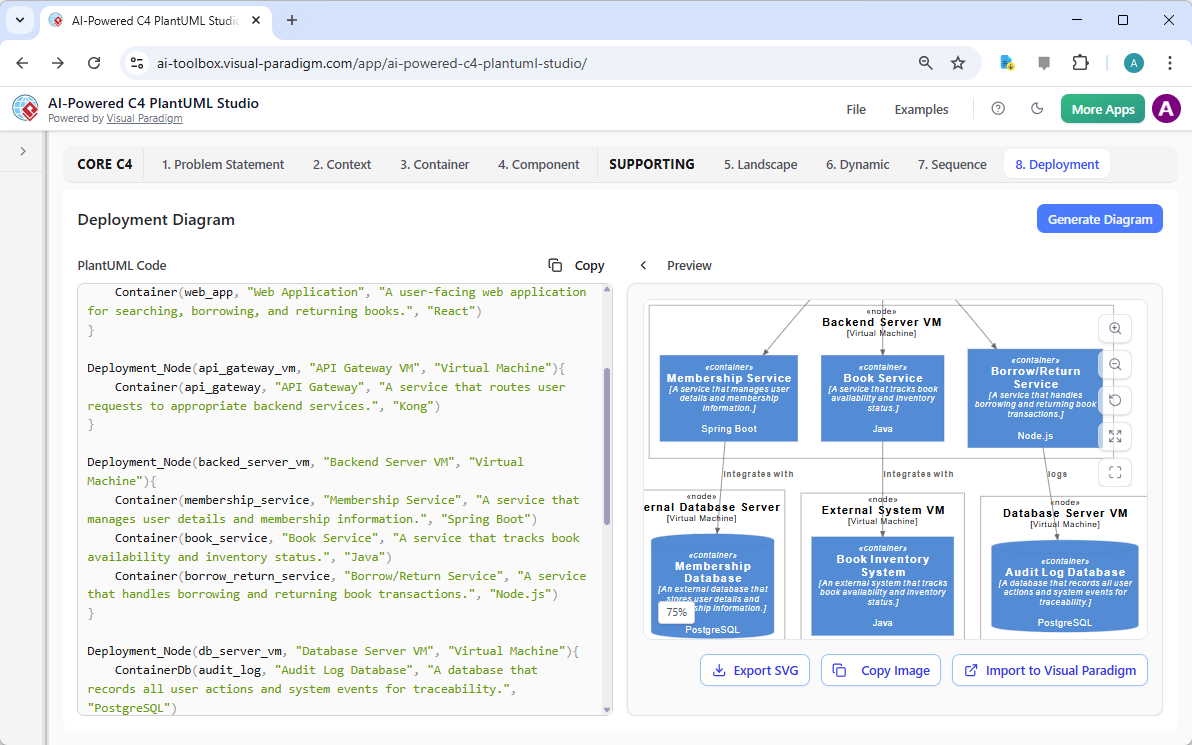
A professional C4 Deployment Diagram auto-generated with Visual Paradigm’s AI-Powered C4 PlantUML Studio
Pro Tip: Customize with cloud provider icons (AWS, Azure, GCP), clustering, or scaling notes by editing the PlantUML code — the AI supports rich deployment notation.
Best Practices for Effective Deployment Diagrams:
- Show runtime instances, not just logical containers
- Include key infrastructure elements (load balancers, firewalls, CDNs, databases)
- Use icons for clarity (e.g., AWS/GCP/Kubernetes symbols) and always add a legend
- Indicate environments (prod/staging/dev) if multiple are relevant
- Highlight resilience, scaling, and security boundaries
Visual Paradigm’s AI applies these best practices automatically, helping you create production-ready deployment views quickly and accurately.
Conclusion: You’ve Completed Your Full C4 Model Journey!
Congratulations! By following this series, you have now successfully built a complete, consistent, and professional C4 model using Visual Paradigm’s AI-Powered C4 PlantUML Studio — including:
- Core levels: Context → Container → Component
- Supporting diagrams: Landscape, Dynamic, and Deployment
Your architecture is now fully documented at every level of abstraction — from high-level enterprise overviews to runtime behaviors and physical infrastructure. This comprehensive model is invaluable for onboarding, decision-making, communication with stakeholders, DevOps collaboration, and future evolution of your system.
Visual Paradigm stands out as the most advanced, AI-driven platform for C4 modeling — combining intelligent generation, seamless PlantUML integration, and enterprise-grade features to make complex architecture documentation simple, fast, and maintainable.
Thank you for following along! Continue exploring Visual Paradigm’s full suite of tools to take your software architecture visualization to the next level. Happy modeling!