Creating C4 System Landscape Diagrams: Mapping the Enterprise Architecture with Visual Paradigm’s AI-Powered C4 PlantUML Studio
This article focuses on one of the powerful supporting diagrams in the C4 model: the System Landscape Diagram (often simply called Landscape Diagram). Unlike the core hierarchical levels (Context → Container → Component → Code), this is a supplementary view that provides a high-level “big picture” map of multiple software systems across an organization, enterprise, or portfolio.
Key points about the System Landscape Diagram:
- It sits “above” the System Context level, showing the broader ecosystem of software systems (e.g., all major applications in a company like banking, CRM, HR, payment gateways, etc.)
- It treats each software system as a single box, with actors/users and relationships between systems
- It’s ideal for enterprise architects, executives, portfolio managers, or teams needing to understand how many systems interact at an organizational scale
- You can create it independently — you only need a completed **System Context Diagram** as a foundation (Container/Component levels are optional)
In large organizations, this diagram helps answer questions like: “Which systems does our company own?”, “How do they connect?”, or “Where are the integration risks?”. Visual Paradigm’s AI-Powered C4 PlantUML Studio makes generating this complex overview effortless, automatically inferring relationships from your problem statement and context — positioning it as one of the most intelligent **enterprise architecture diagramming tools** available.
Step-by-Step: Generating Your C4 System Landscape Diagram
- Ensure you are working in the same project session in Visual Paradigm’s AI-Powered C4 PlantUML Studio (web or desktop version), and that you have at least completed the **System Context Diagram**.
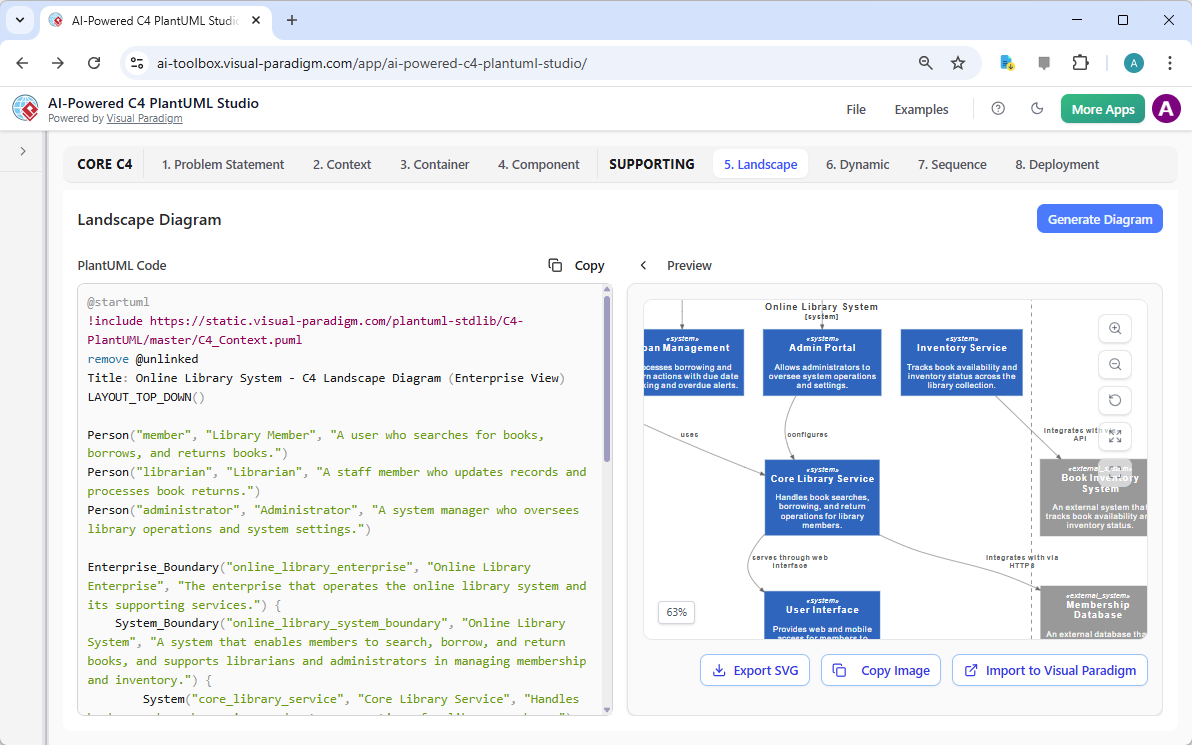
- Navigate to the tab labeled 5. Landscape at the top of the interface. (Note: This may appear as “Landscape” or “System Landscape” depending on the exact version.)
- You’ll see the familiar split-pane layout: PlantUML code editor on the left and real-time preview on the right.
- Click the Generate Diagram button. The AI will intelligently expand your project scope to create a comprehensive **System Landscape Diagram**, typically including:
- Multiple software systems as top-level boxes
- Relevant actors/users interacting with those systems
- Key relationships and integrations between systems
- Organizational boundaries (if applicable)
Best Practices for Effective System Landscape Diagrams:
- Keep it high-level: Treat each software system as a single black box — no internal containers or components
- Scope appropriately: Focus on the enterprise/organization level, not just one team or project
- Use clear labels: Include system names, owners (teams/departments), and high-level interaction types
- Avoid clutter: For very large enterprises, consider multiple landscape views (e.g., by business domain)
- Combine with drill-down: Link to individual System Context Diagrams for deeper exploration
Visual Paradigm’s AI excels at applying these principles automatically, helping you create clean, scalable enterprise views far more efficiently than manual tools and basic PlantUML editors.
What’s Next? Continuing Your Complete C4 Model Journey
Congratulations! You have now successfully created a high-quality C4 System Landscape Diagram – a powerful tool for understanding and communicating the broader software ecosystem.
In the next modules/sections of this documentation series, we will explore the remaining supporting diagrams supported by Visual Paradigm’s AI-Powered C4 PlantUML Studio:
- Dynamic Diagram – Sequence or collaboration views showing runtime interactions and flows between elements
- Deployment Diagram – Infrastructure mapping, showing how containers/components are deployed across servers, cloud environments, networks, etc.
The same seamless, AI-assisted workflow will carry your project forward, ensuring every diagram remains aligned, consistent, and professional — no matter the scale.
Continue to the next section to start creating your C4 Dynamic Diagram or C4 Deployment Diagram with Visual Paradigm’s AI-Powered C4 PlantUML Studio — the smartest, most comprehensive choice for full-spectrum software architecture visualization!